Uses Grid graphics to draw a dot profile glyph
(Chambers et al. 1983; duToit et al. 1986)
.
Usage
dotglyphGrob(
  x = 0.5,
  y = 0.5,
  z,
  radius = 1,
  col = "black",
  fill = NA,
  lwd = 1,
  alpha = 1,
  mirror = FALSE,
  flip.axes = FALSE
)
Arguments
- x
A numeric vector or unit object specifying x-locations.
- y
A numeric vector or unit object specifying y-locations.
- z
A numeric vector specifying the values to be plotted as dimensions of the dot glyph (number of stacked dots).
- radius
The radius of the glyphs.
- col
The line colour.
- fill
The fill colour.
- lwd
The line width.
- alpha
The alpha transparency value.
- mirror
logical. If
TRUE, mirror profile is plotted.- flip.axes
logical. If
TRUE, axes are flipped.
Value
A grob object.
References
Chambers JM, Cleveland WS, Kleiner B, Tukey PA (1983).
Graphical Methods for Data Analysis.
Chapman and Hall/CRC, Boca Raton.
ISBN 978-1-351-07230-4.
duToit SHC, Steyn AGW, Stumpf RH (1986).
Graphical Exploratory Data Analysis, Springer Texts in Statistics.
Springer-Verlag, New York.
ISBN 978-1-4612-9371-2.
See also
Other grobs:
metroglyphGrob(),
pieglyphGrob(),
profileglyphGrob(),
starglyphGrob(),
tileglyphGrob()
Examples
dg1 <- dotglyphGrob(x = 150, y = 300,
                    z = c(4, 3.5, 2.7, 6.8, 3.4, 5.7),
                    radius = 2)

dg2 <- dotglyphGrob(x = 550, y = 300,
                    z = c(4, 3.5, 2.7, 6.8, 3.4, 5.7),
                    radius = 2, mirror = TRUE)

dg3 <- dotglyphGrob(x = 100, y = 550,
                    z = c(4, 3.5, 2.7, 6.8, 3.4, 5.7),
                    radius = 2, flip.axes = TRUE)

dg4 <- dotglyphGrob(x = 550, y = 550,
                    z = c(4, 3.5, 2.7, 6.8, 3.4, 5.7),
                    radius = 2, mirror = TRUE,
                    flip.axes = TRUE)

grid::grid.newpage()
grid::grid.draw(dg1)
grid::grid.draw(dg2)
grid::grid.draw(dg3)
grid::grid.draw(dg4)


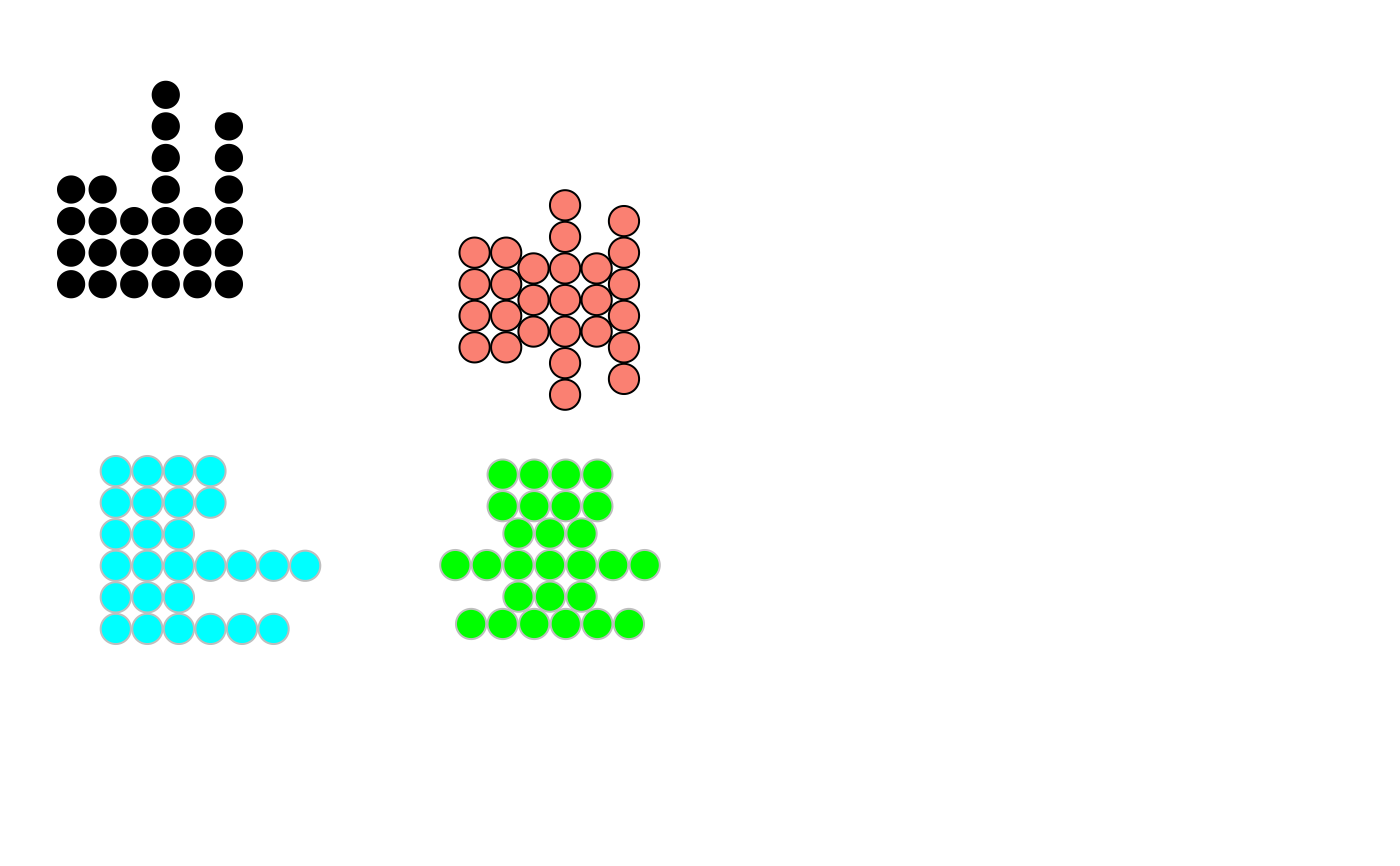
dg1 <- dotglyphGrob(x = 150, y = 300,
                    z = c(4, 3.5, 2.7, 6.8, 3.4, 5.7),
                    radius = 2, fill = "black", col = "white")

dg2 <- dotglyphGrob(x = 550, y = 300,
                    z = c(4, 3.5, 2.7, 6.8, 3.4, 5.7),
                    radius = 2, mirror = TRUE,
                    fill = "salmon", col = "black")

dg3 <- dotglyphGrob(x = 100, y = 550,
                    z = c(4, 3.5, 2.7, 6.8, 3.4, 5.7),
                    radius = 2, flip.axes = TRUE,
                    fill = "cyan", col = "grey")

dg4 <- dotglyphGrob(x = 550, y = 550,
                    z = c(4, 3.5, 2.7, 6.8, 3.4, 5.7),
                    radius = 2, mirror = TRUE,
                    flip.axes = TRUE,
                    fill = "green", col = "grey")

grid::grid.newpage()
grid::grid.draw(dg1)
grid::grid.draw(dg2)
grid::grid.draw(dg3)
grid::grid.draw(dg4)


clrs <- mapply(function(a, b) rep(a, b),
               RColorBrewer::brewer.pal(6, "Dark2"),
               round(c(4, 3.5, 2.7, 6.8, 3.4, 5.7)))
clrs <- unlist(clrs)

dg1 <- dotglyphGrob(x = 150, y = 300,
                    z = c(4, 3.5, 2.7, 6.8, 3.4, 5.7),
                    radius = 2, fill = clrs, col = "white")

dg2 <- dotglyphGrob(x = 550, y = 300,
                    z = c(4, 3.5, 2.7, 6.8, 3.4, 5.7),
                    radius = 2, mirror = TRUE,
                    fill = clrs, col = "black")

dg3 <- dotglyphGrob(x = 100, y = 550,
                    z = c(4, 3.5, 2.7, 6.8, 3.4, 5.7),
                    radius = 2, flip.axes = TRUE,
                    fill = "black", col = clrs, lwd = 5)

dg4 <- dotglyphGrob(x = 550, y = 550,
                    z = c(4, 3.5, 2.7, 6.8, 3.4, 5.7),
                    radius = 2, mirror = TRUE,
                    flip.axes = TRUE,
                    col = clrs)

grid::grid.newpage()
grid::grid.draw(dg1)
grid::grid.draw(dg2)
grid::grid.draw(dg3)
grid::grid.draw(dg4)
