biplot.pcss.core generates biplots of scores of genotypes with or
without vectors for traits from the output of pcss.core.
Arguments
- x
An object of class
pcss.core.- ndim
The number of dimensions for which biplots have to plotted.
- highlight.core
The core collection to be highlighted. Either
"size","variance","logistic", or"none". See Details.- show.traits
Which kind of the traits to be shown in the biplot. Either
"all","none","quantitative"or"qualitative".- qual.scale
A scale factor to be applied to qualitative trait coordinates plotted in biplot.
- quant.scale
A scale factor to be applied to quantitative trait coordinates plotted in biplot.
- point.alpha
Alpha transparency value for biplot points.
- segment.alpha
Alpha transparency value for biplot segments.
- ...
Unused.
Details
Use "size" to highlight core collection according to the threshold
size criterion or use "variance" to highlight core collection
according to the variability threshold criterion or use "logistic" to
highlight core collection generated according to inflection point of rate of
progress of cumulative variability retained identified by logistic
regression. Use "none" to not highlight any accessions.
Examples
#~~~~~~~~~~~~~~~~~~~~~~~~~~~~~~~~~~~~~~~~~~~~~~~~~~~~~~~~~~~~~~~~~~~~~~~~~~~~
# Prepare example data
#~~~~~~~~~~~~~~~~~~~~~~~~~~~~~~~~~~~~~~~~~~~~~~~~~~~~~~~~~~~~~~~~~~~~~~~~~~~~
suppressPackageStartupMessages(library(EvaluateCore))
# Get data from EvaluateCore
data("cassava_EC", package = "EvaluateCore")
data = cbind(Genotypes = rownames(cassava_EC), cassava_EC)
quant <- c("NMSR", "TTRN", "TFWSR", "TTRW", "TFWSS", "TTSW", "TTPW",
"AVPW", "ARSR", "SRDM")
qual <- c("CUAL", "LNGS", "PTLC", "DSTA", "LFRT", "LBTEF", "CBTR", "NMLB",
"ANGB", "CUAL9M", "LVC9M", "TNPR9M", "PL9M", "STRP", "STRC",
"PSTR")
rownames(data) <- NULL
# Convert qualitative data columns to factor
data[, qual] <- lapply(data[, qual], as.factor)
library(FactoMineR)
suppressPackageStartupMessages(library(factoextra))
#~~~~~~~~~~~~~~~~~~~~~~~~~~~~~~~~~~~~~~~~~~~~~~~~~~~~~~~~~~~~~~~~~~~~~~~~~~~~
# With quantitative data
#~~~~~~~~~~~~~~~~~~~~~~~~~~~~~~~~~~~~~~~~~~~~~~~~~~~~~~~~~~~~~~~~~~~~~~~~~~~~
out1 <- pcss.core(data = data, names = "Genotypes",
quantitative = quant,
qualitative = NULL, eigen.threshold = NULL, size = 0.2,
var.threshold = 0.75)
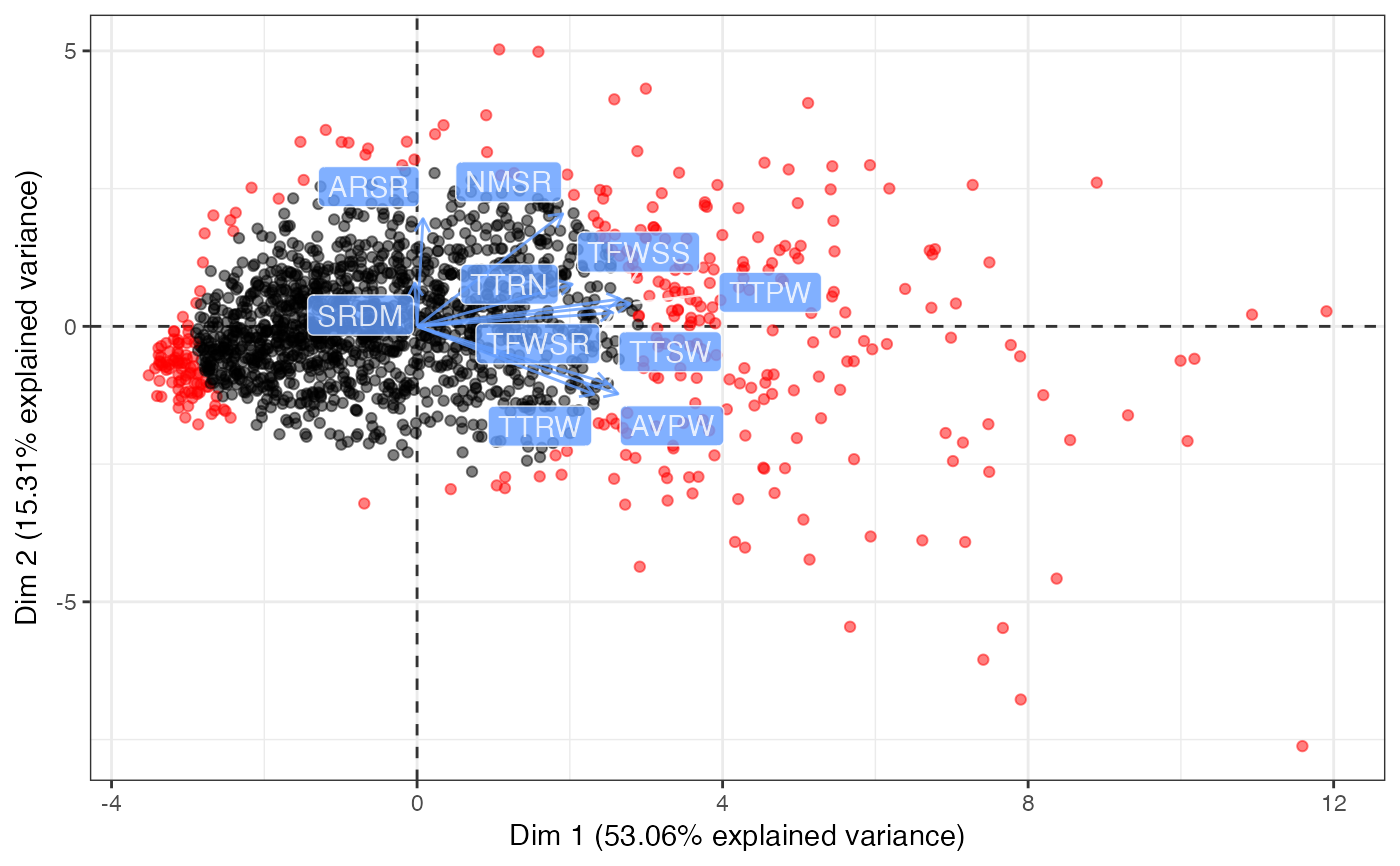
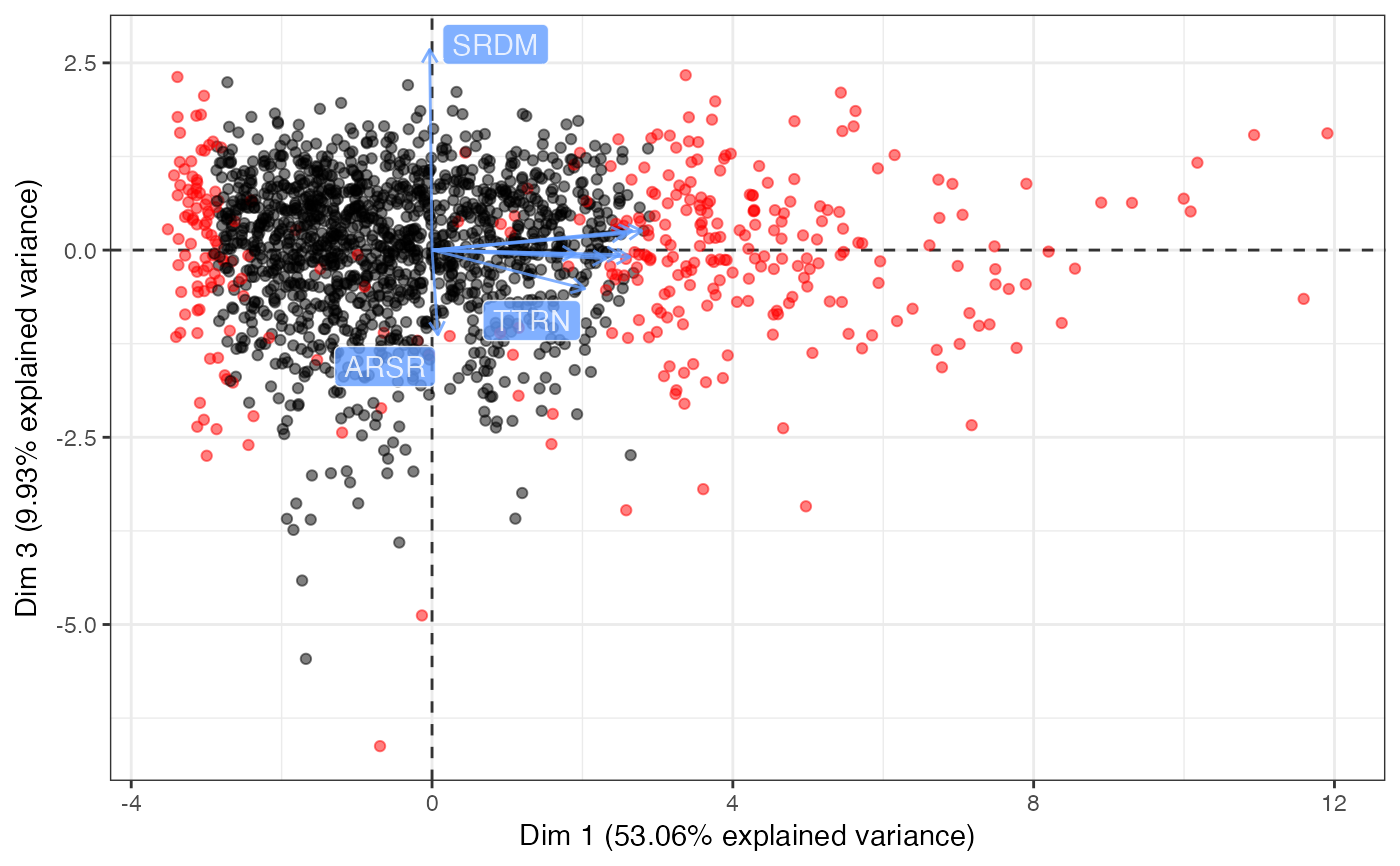
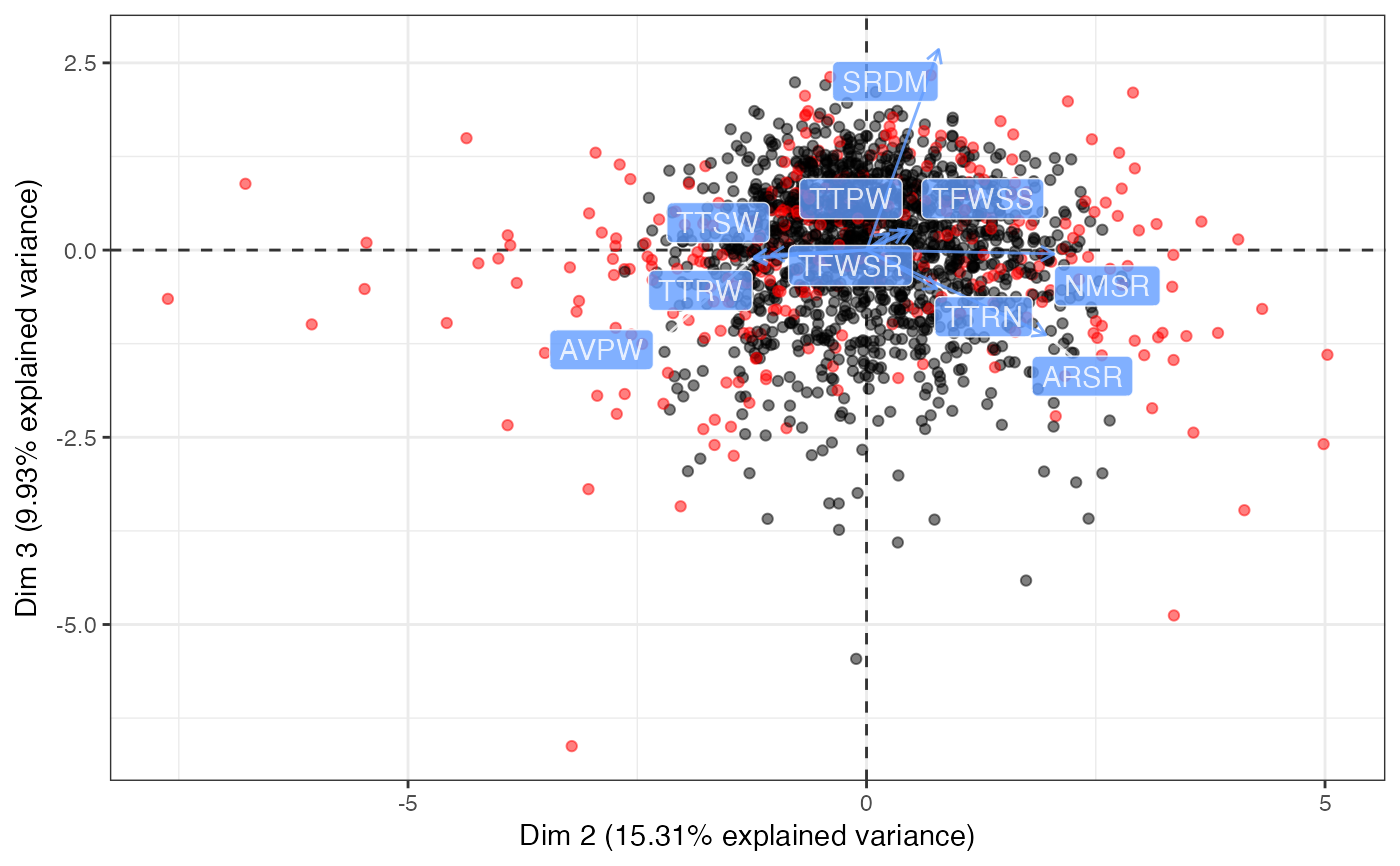
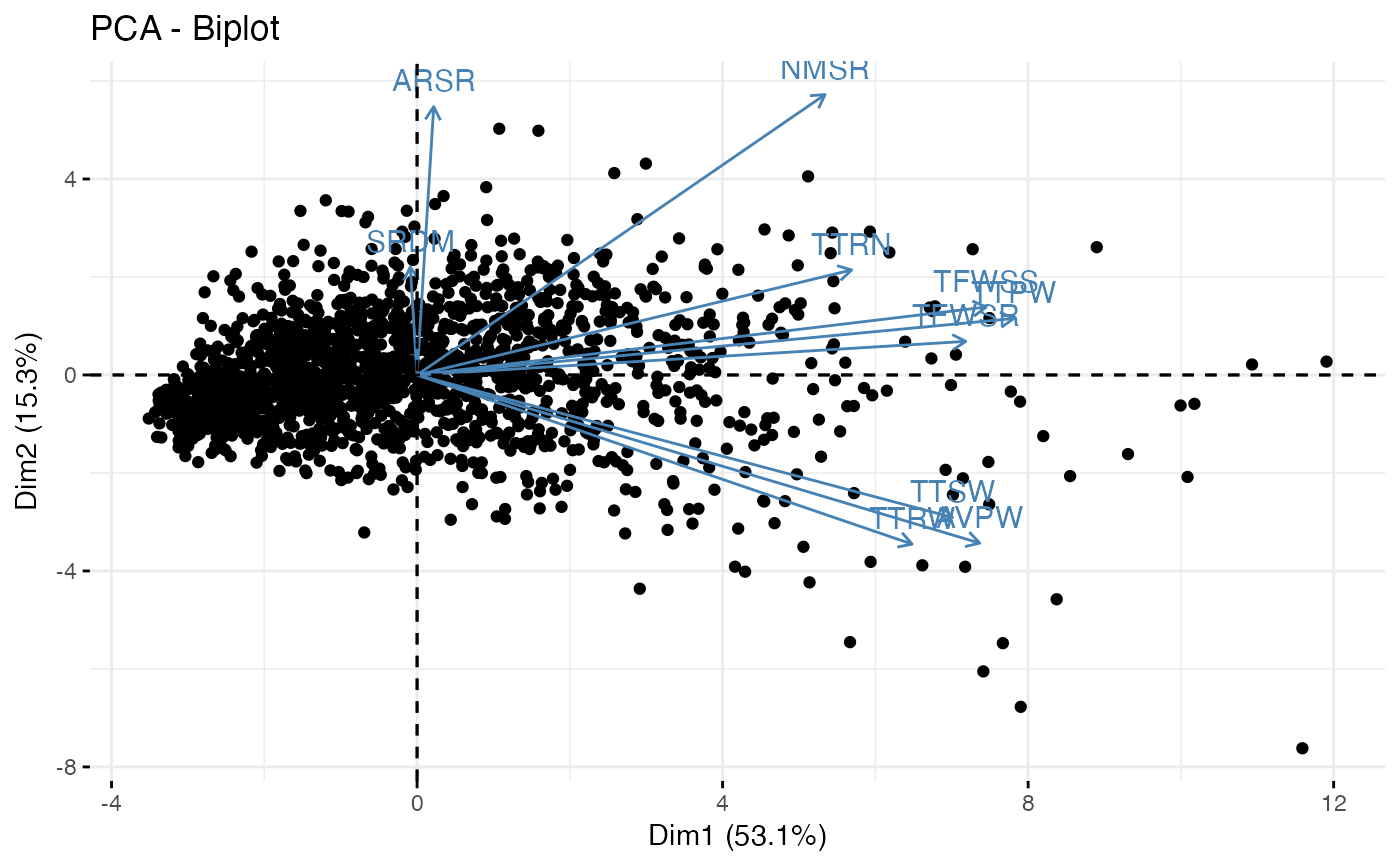
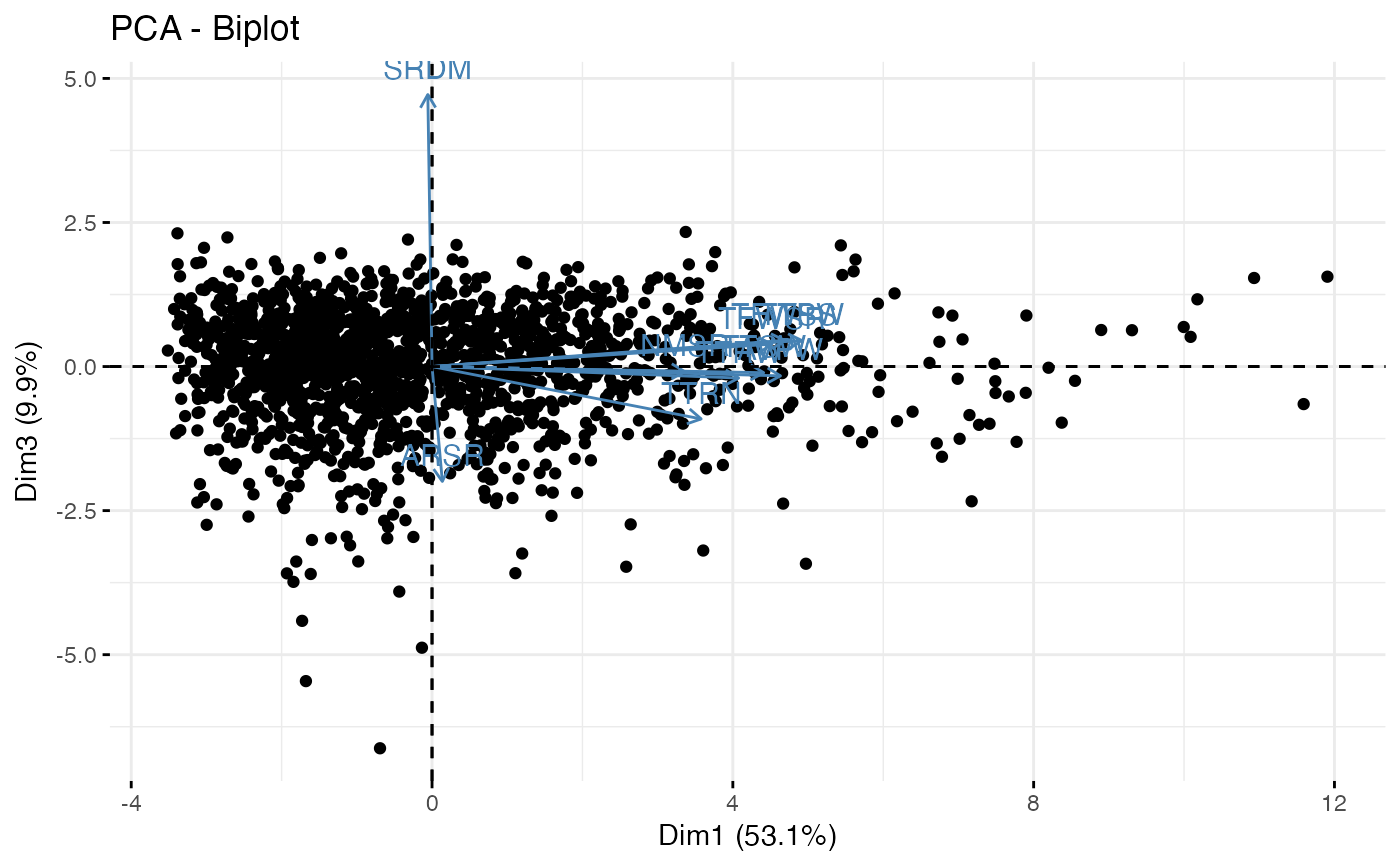
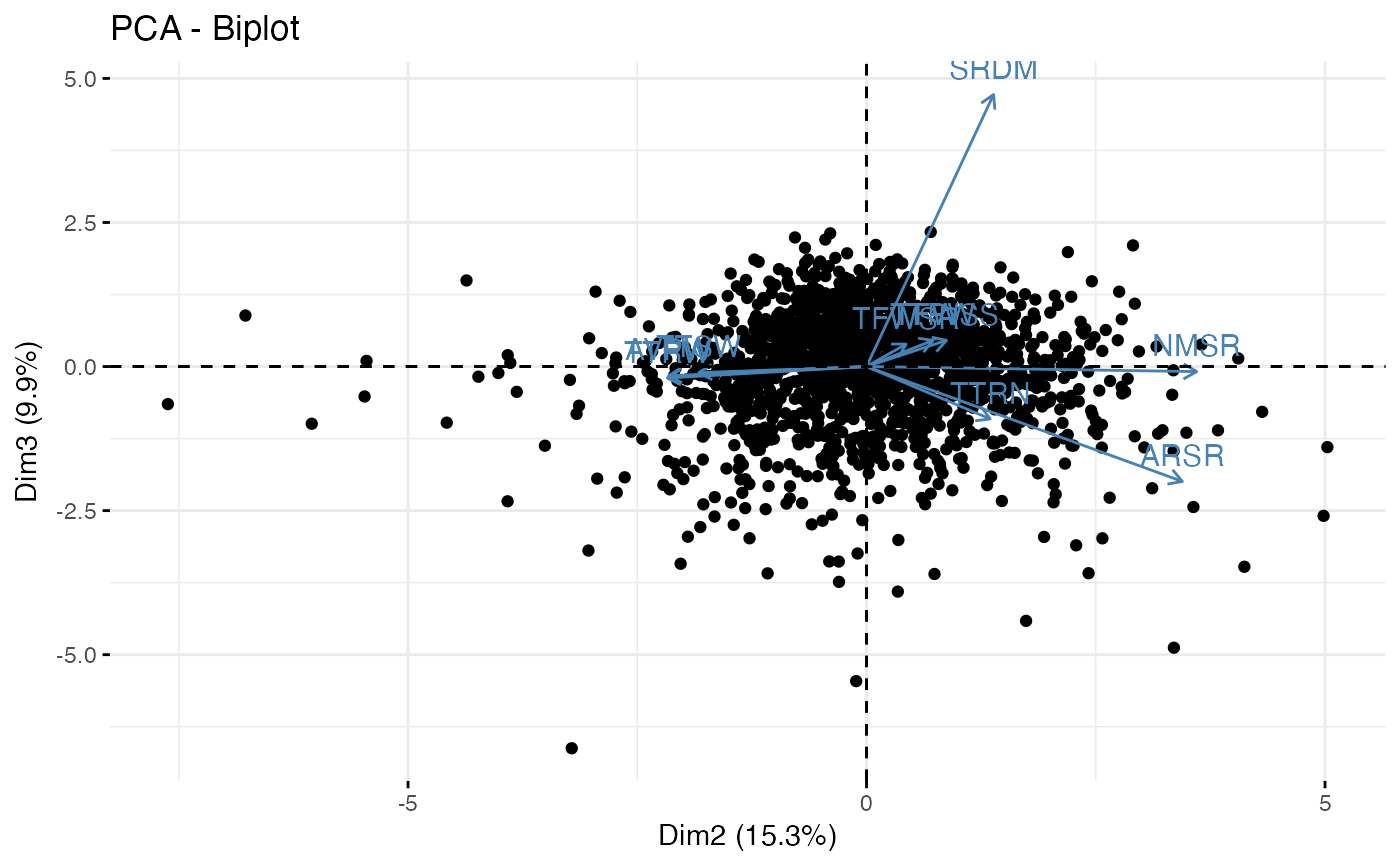
# Plot biplot
biplot(out1, ndim = 3, highlight.core = "size", quant.scale = 3,
point.alpha = 0.5)
#> $`Dim 1 vs. Dim 2`
 #>
#> $`Dim 1 vs. Dim 3`
#>
#> $`Dim 1 vs. Dim 3`
 #>
#> $`Dim 2 vs. Dim 3`
#>
#> $`Dim 2 vs. Dim 3`
 #>
# Plot biplot with FactoMineR
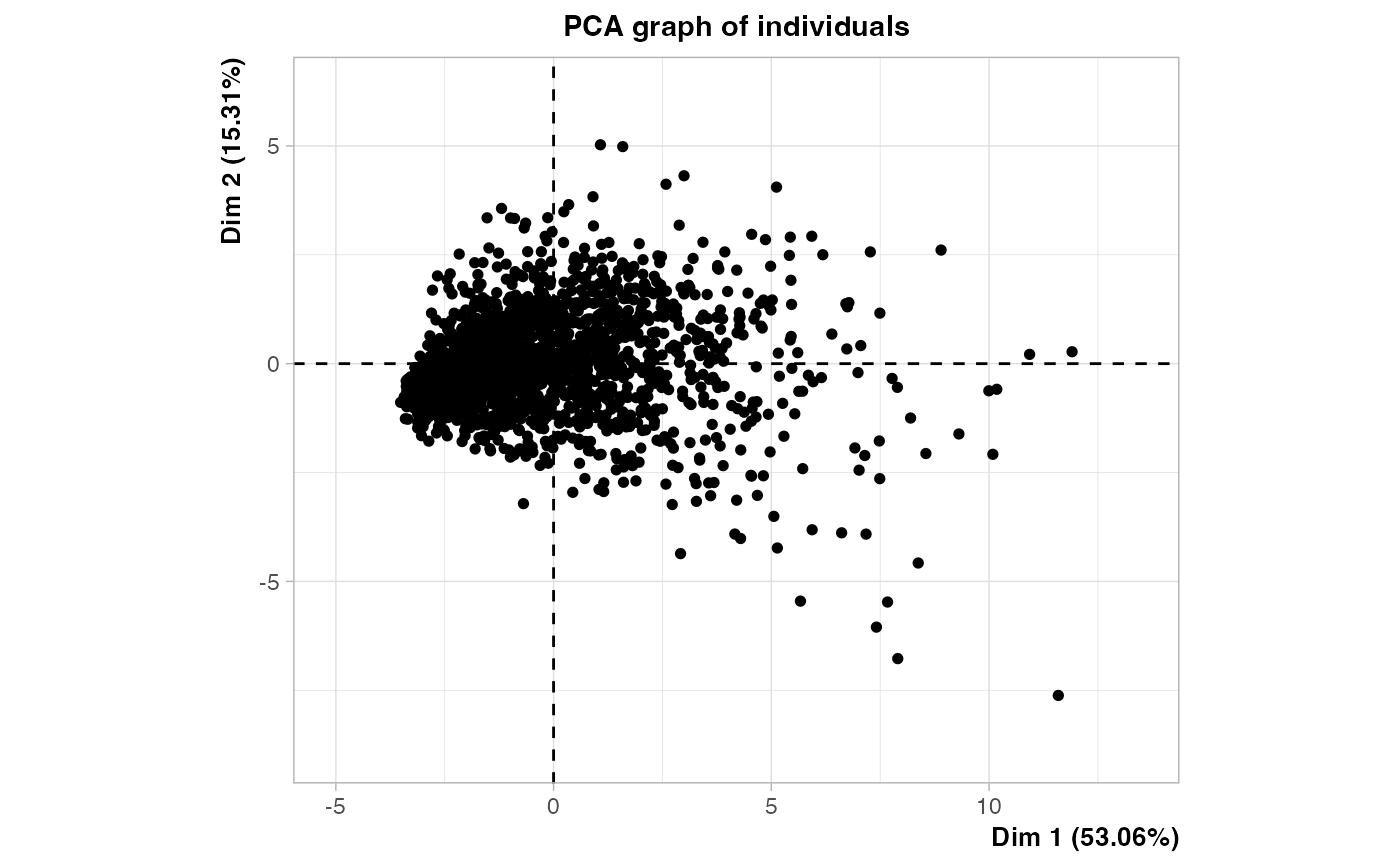
plot(out1$raw.out, choix=c("ind"), label = "none", axes = c(1, 2))
#>
# Plot biplot with FactoMineR
plot(out1$raw.out, choix=c("ind"), label = "none", axes = c(1, 2))
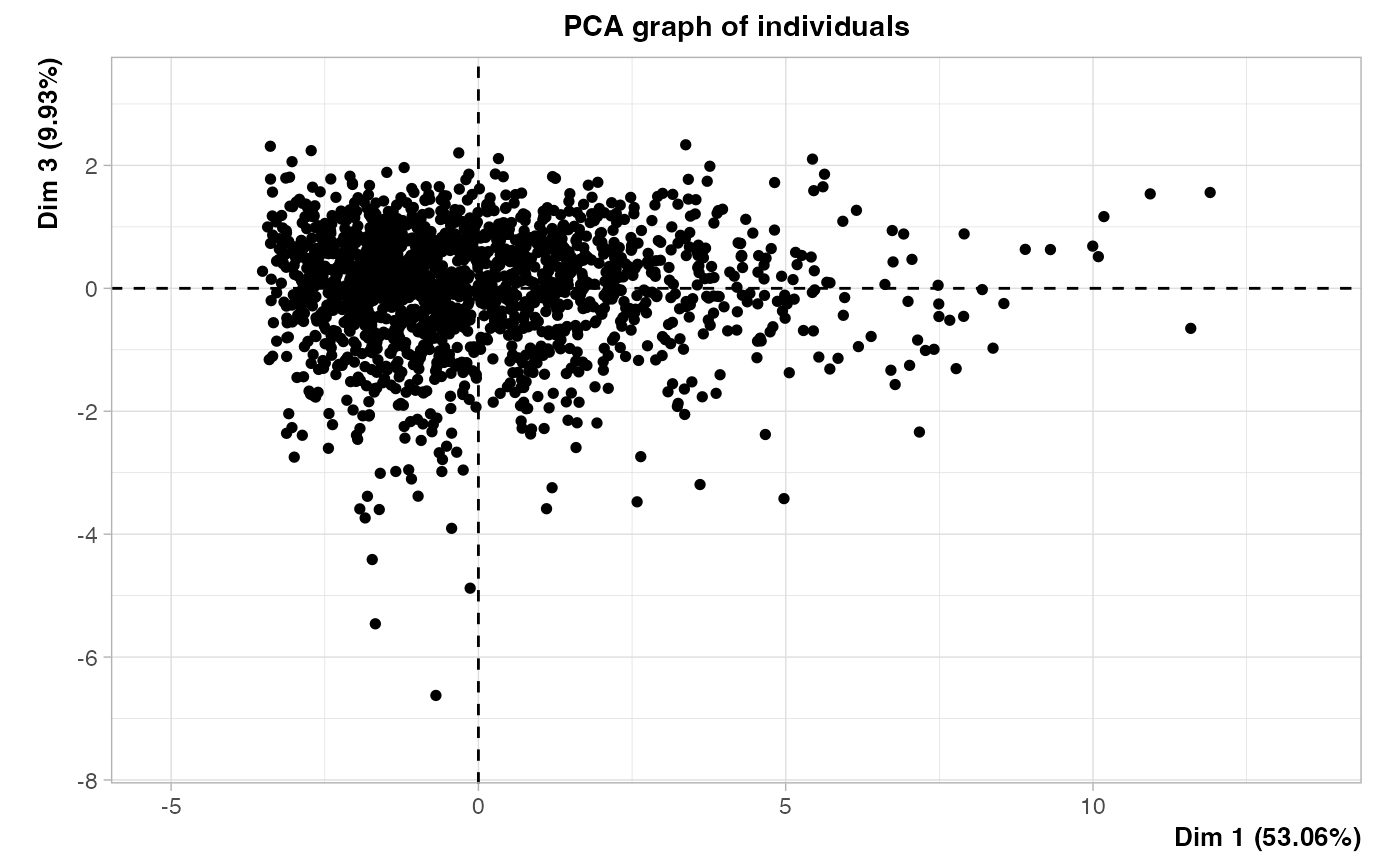
 plot(out1$raw.out, choix=c("ind"), label = "none", axes = c(1, 3))
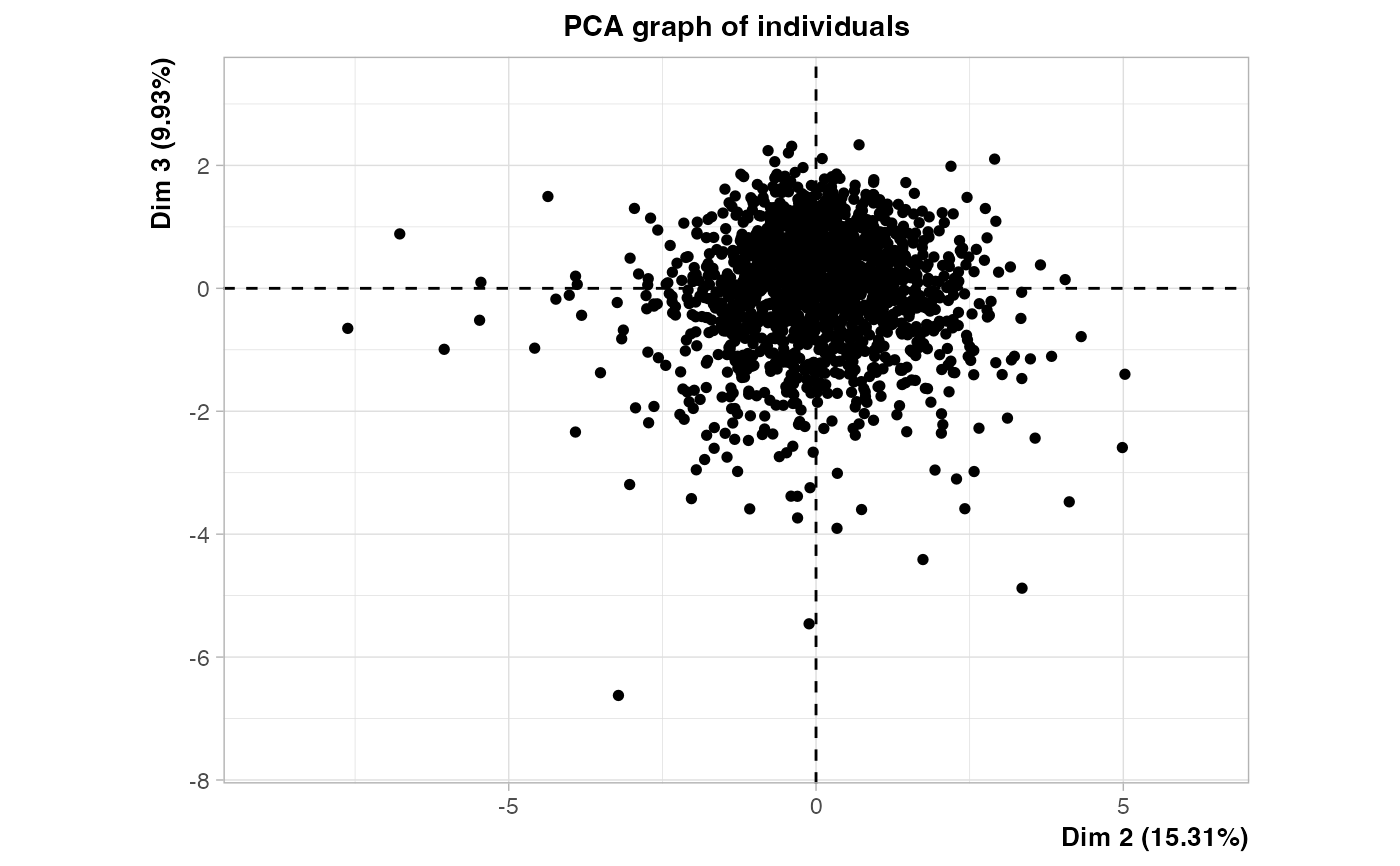
 plot(out1$raw.out, choix=c("ind"), label = "none", axes = c(2, 3))
 # Plot biplot with factoextra
fviz_pca_biplot(out1$raw.out, geom.ind = "point", axes = c(1, 2))
# Plot biplot with factoextra
fviz_pca_biplot(out1$raw.out, geom.ind = "point", axes = c(1, 2))
 fviz_pca_biplot(out1$raw.out, geom.ind = "point", axes = c(1, 3))
 fviz_pca_biplot(out1$raw.out, geom.ind = "point", axes = c(2, 3))
 #~~~~~~~~~~~~~~~~~~~~~~~~~~~~~~~~~~~~~~~~~~~~~~~~~~~~~~~~~~~~~~~~~~~~~~~~~~~~
# Get core sets with PCSS (qualitative data)
#~~~~~~~~~~~~~~~~~~~~~~~~~~~~~~~~~~~~~~~~~~~~~~~~~~~~~~~~~~~~~~~~~~~~~~~~~~~~
out2 <- pcss.core(data = data, names = "Genotypes", quantitative = NULL,
qualitative = qual, eigen.threshold = NULL,
size = 0.2, var.threshold = 0.75)
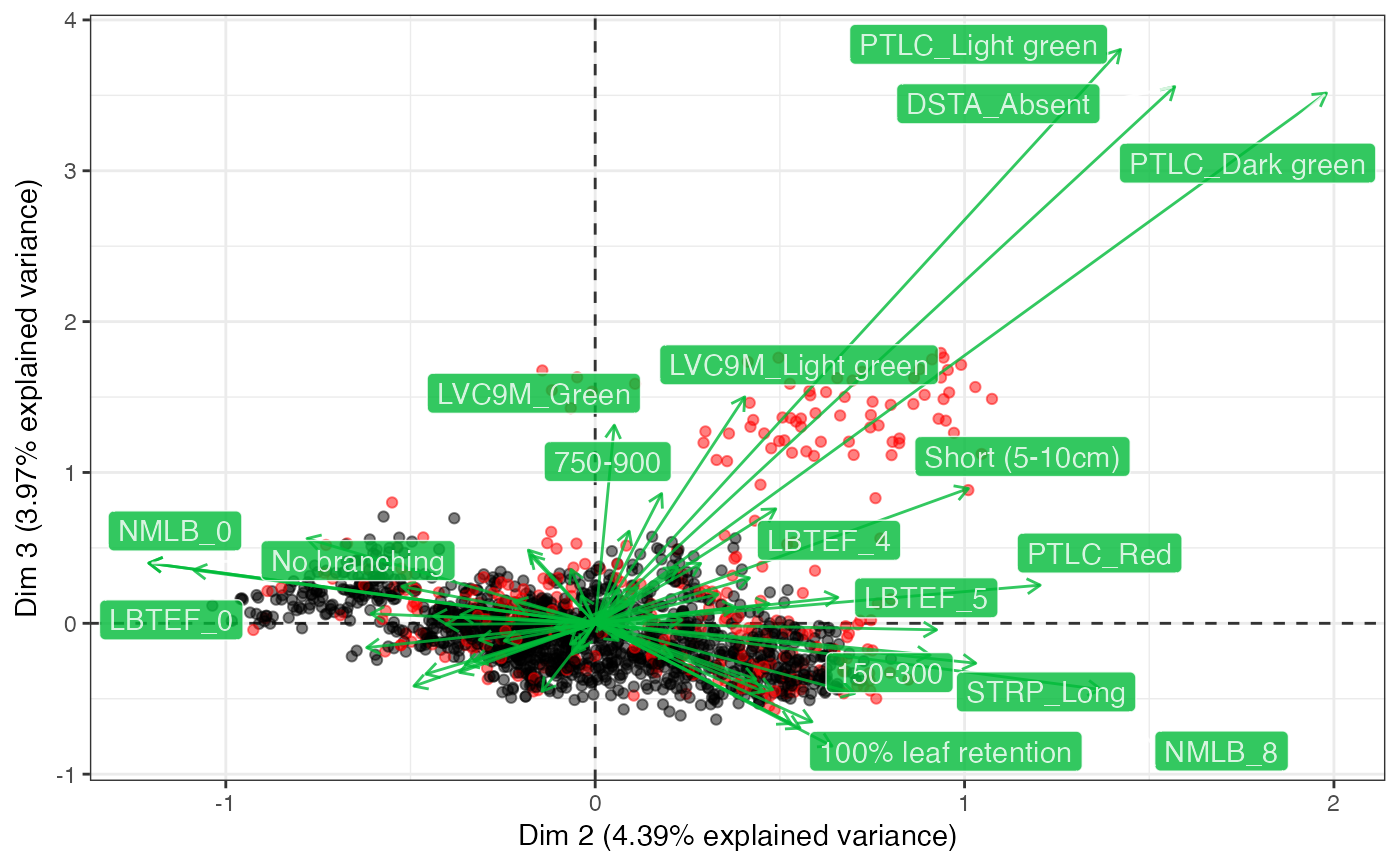
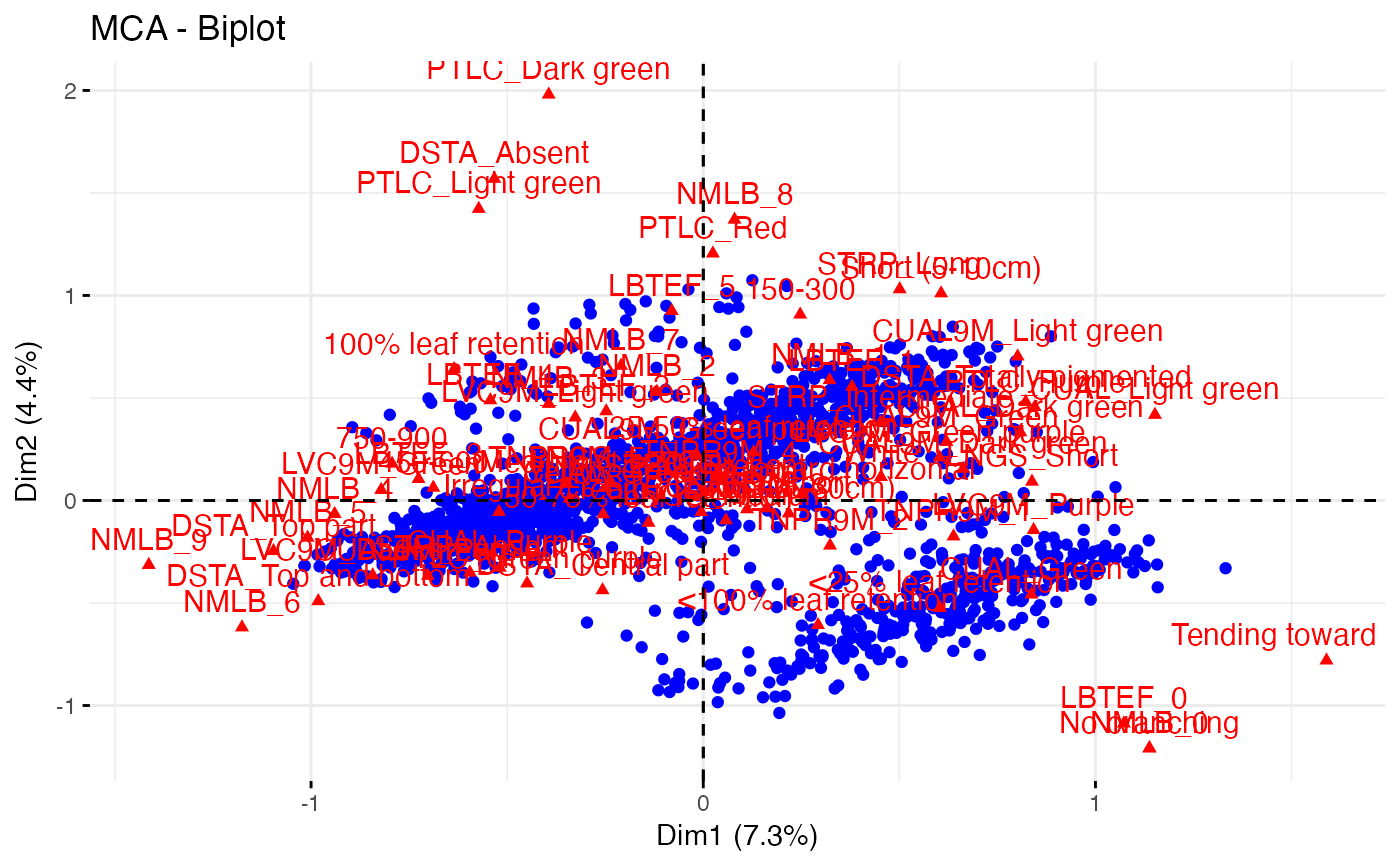
# Plot biplot
biplot(out2, ndim = 3, highlight.core = "size", qual.scale = 1,
point.alpha = 0.5)
#> $`Dim 1 vs. Dim 2`
#~~~~~~~~~~~~~~~~~~~~~~~~~~~~~~~~~~~~~~~~~~~~~~~~~~~~~~~~~~~~~~~~~~~~~~~~~~~~
# Get core sets with PCSS (qualitative data)
#~~~~~~~~~~~~~~~~~~~~~~~~~~~~~~~~~~~~~~~~~~~~~~~~~~~~~~~~~~~~~~~~~~~~~~~~~~~~
out2 <- pcss.core(data = data, names = "Genotypes", quantitative = NULL,
qualitative = qual, eigen.threshold = NULL,
size = 0.2, var.threshold = 0.75)
# Plot biplot
biplot(out2, ndim = 3, highlight.core = "size", qual.scale = 1,
point.alpha = 0.5)
#> $`Dim 1 vs. Dim 2`
 #>
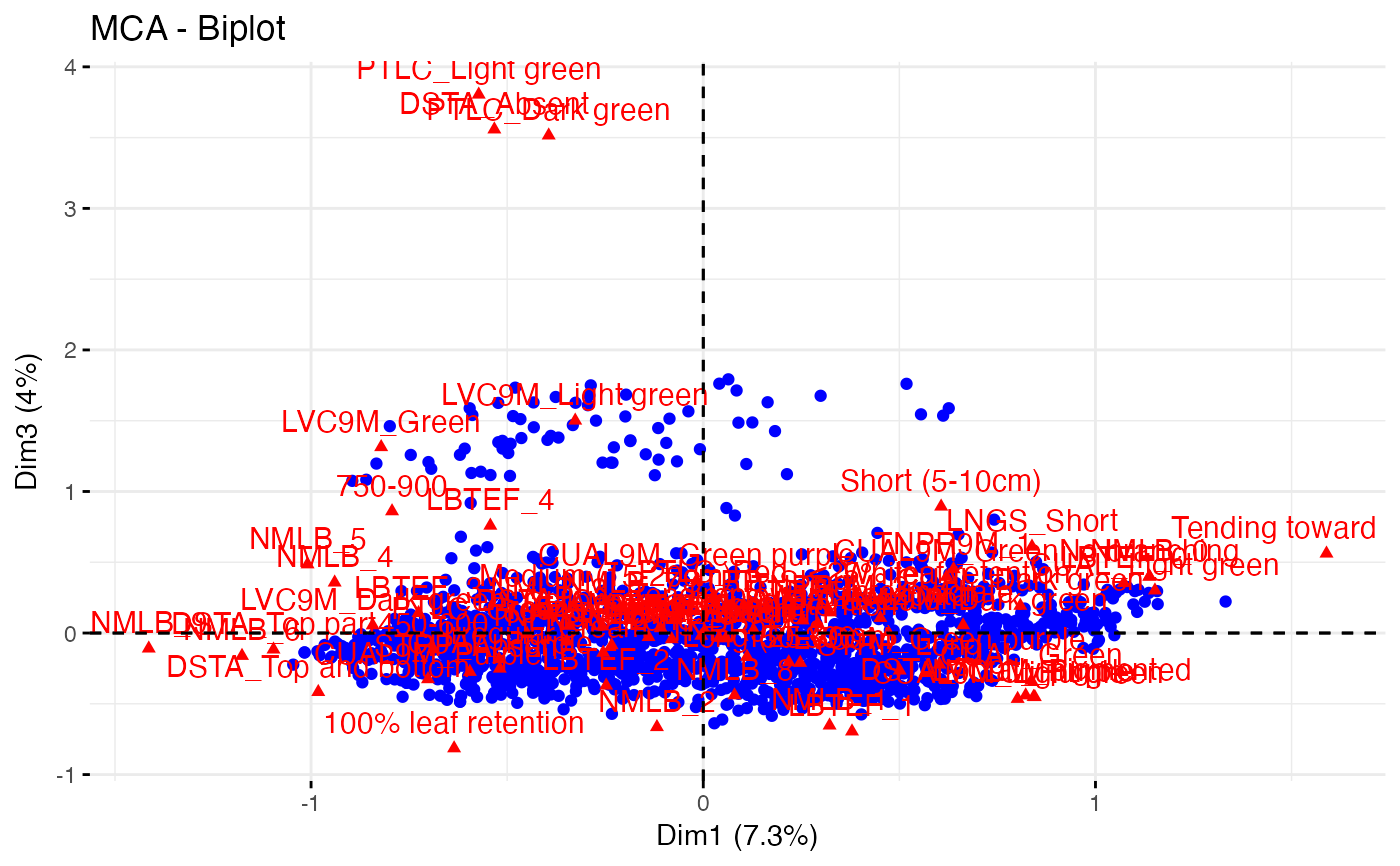
#> $`Dim 1 vs. Dim 3`
#>
#> $`Dim 1 vs. Dim 3`
 #>
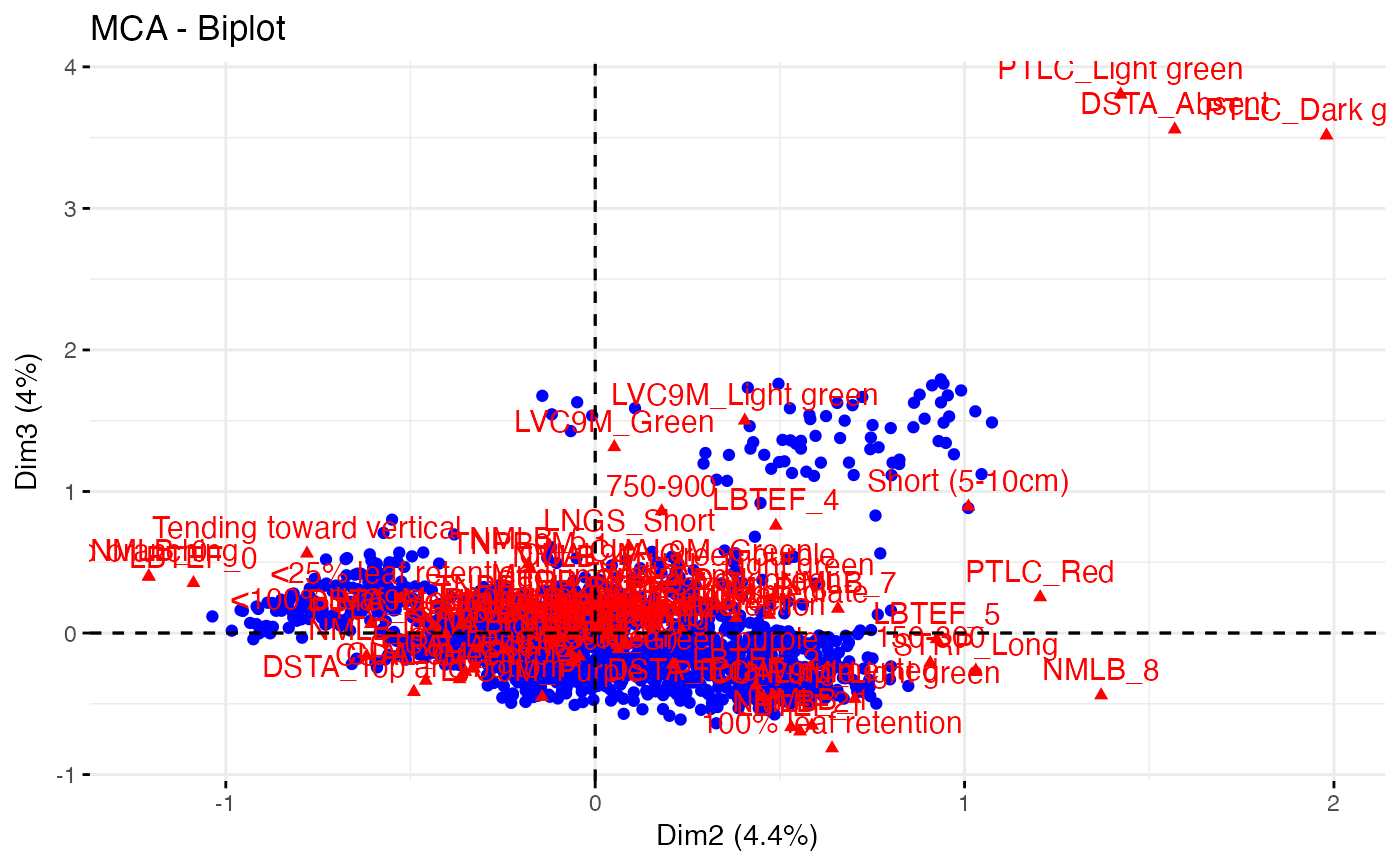
#> $`Dim 2 vs. Dim 3`
#>
#> $`Dim 2 vs. Dim 3`
 #>
# Plot biplot with FactoMineR
plot(out2$raw.out, choix=c("ind"), label = "none", axes = c(1, 2))
#>
# Plot biplot with FactoMineR
plot(out2$raw.out, choix=c("ind"), label = "none", axes = c(1, 2))
 plot(out2$raw.out, choix=c("ind"), label = "none", axes = c(1, 3))
 plot(out2$raw.out, choix=c("ind"), label = "none", axes = c(2, 3))
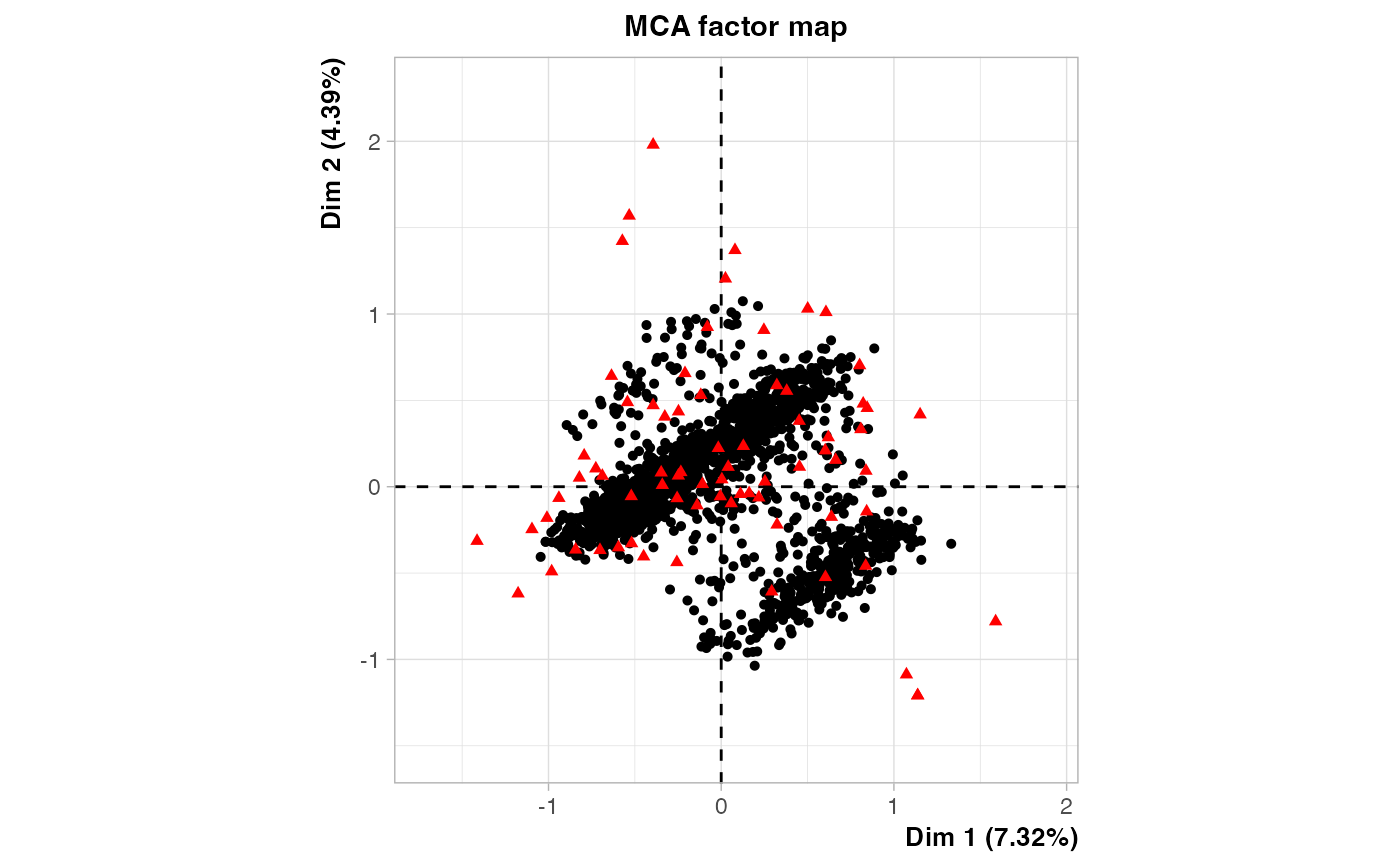
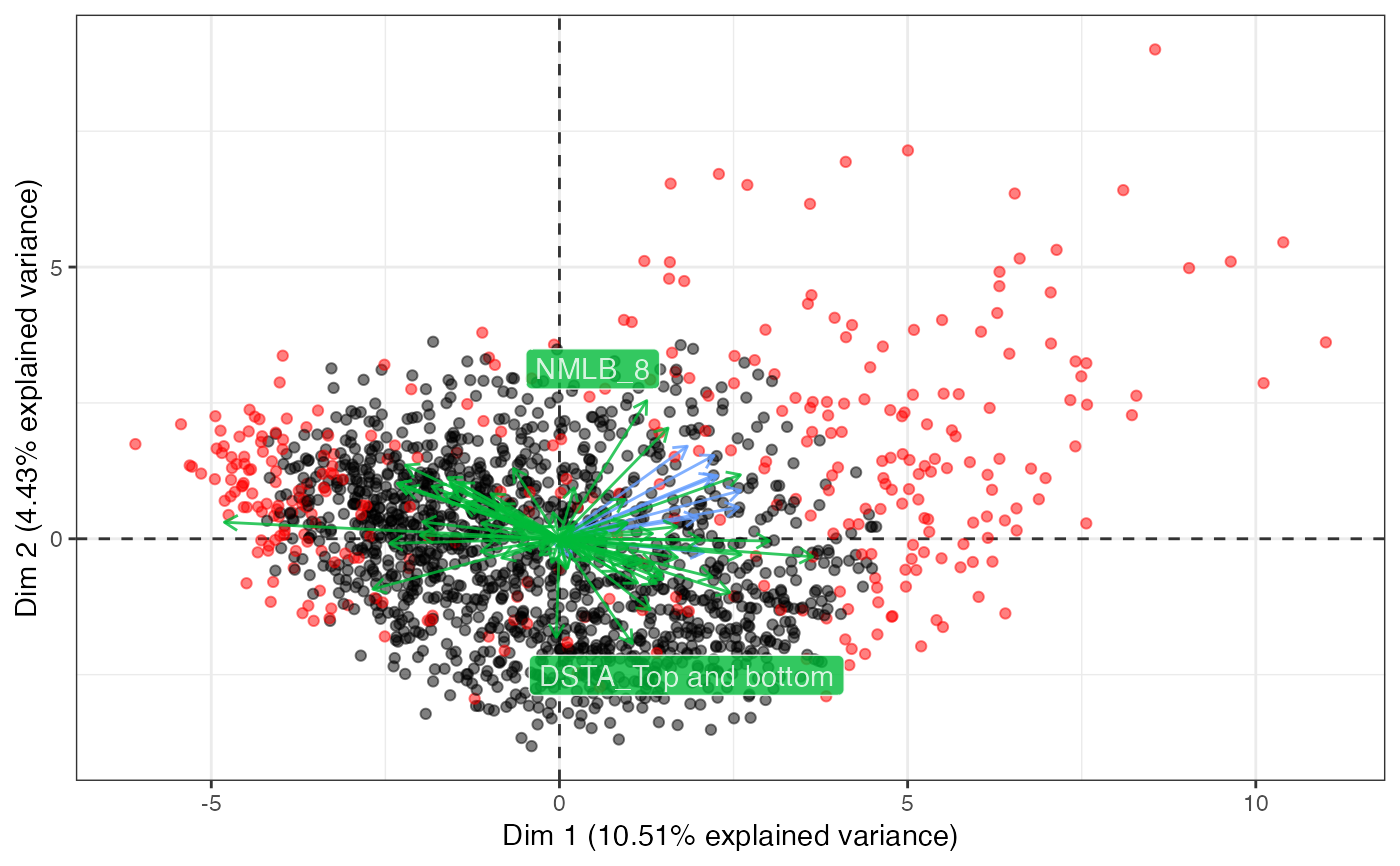
 # Plot biplot with factoextra
fviz_mca_biplot(out2$raw.out, geom.ind = "point", axes = c(1, 2))
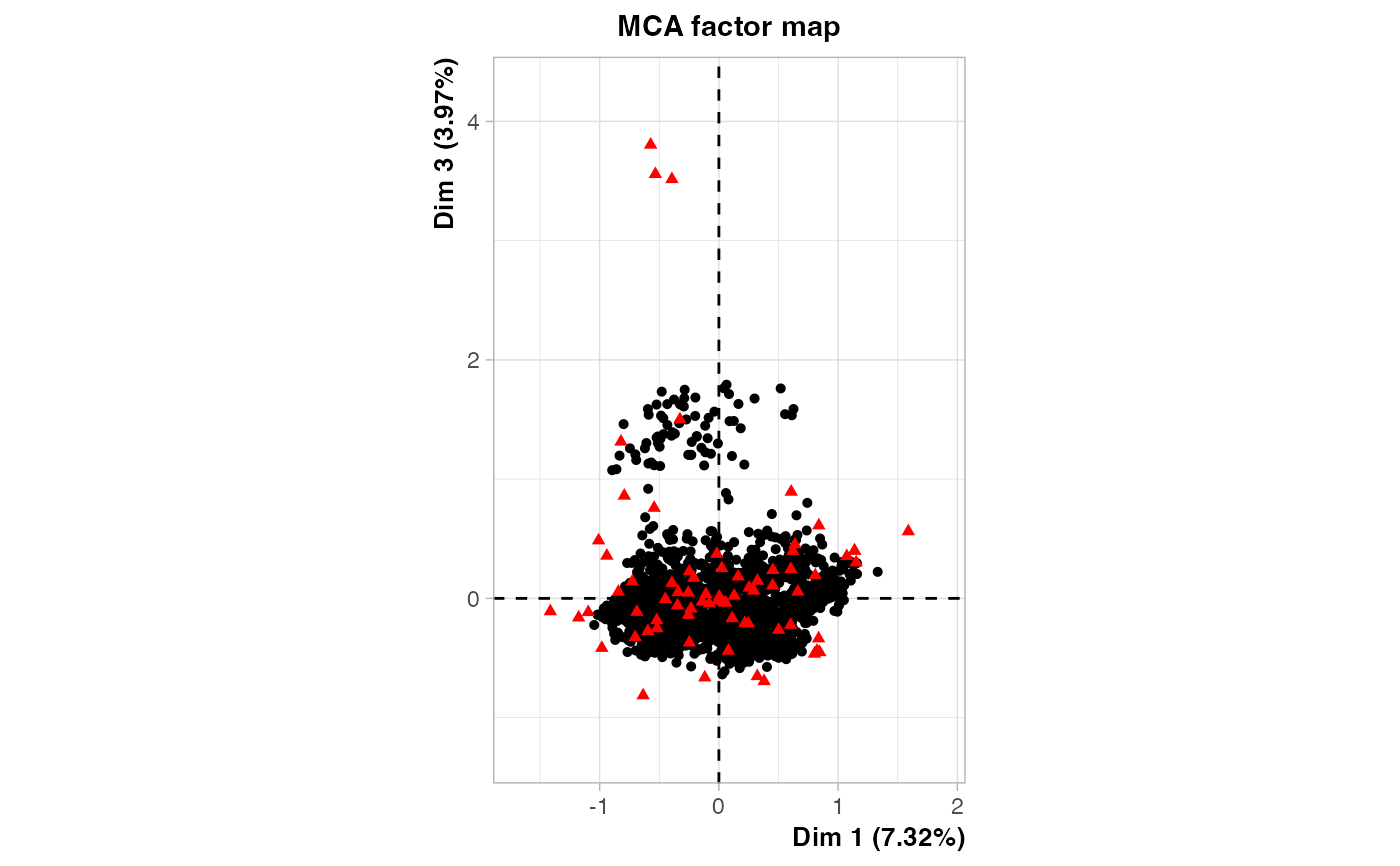
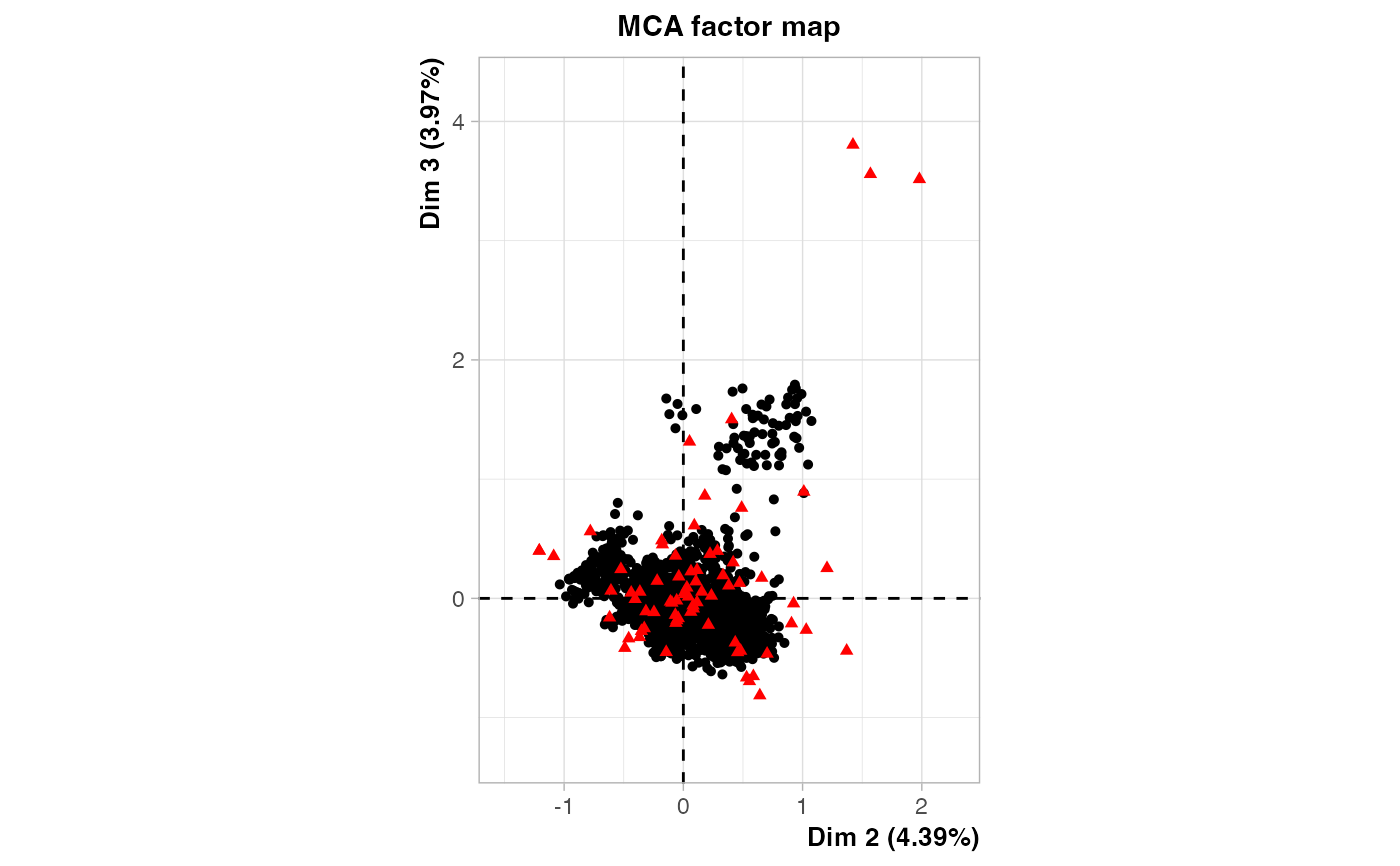
# Plot biplot with factoextra
fviz_mca_biplot(out2$raw.out, geom.ind = "point", axes = c(1, 2))
 fviz_mca_biplot(out2$raw.out, geom.ind = "point", axes = c(1, 3))
 fviz_mca_biplot(out2$raw.out, geom.ind = "point", axes = c(2, 3))
 #~~~~~~~~~~~~~~~~~~~~~~~~~~~~~~~~~~~~~~~~~~~~~~~~~~~~~~~~~~~~~~~~~~~~~~~~~~~~
# Get core sets with PCSS (quantitative and qualitative data)
#~~~~~~~~~~~~~~~~~~~~~~~~~~~~~~~~~~~~~~~~~~~~~~~~~~~~~~~~~~~~~~~~~~~~~~~~~~~~
out3 <- pcss.core(data = data, names = "Genotypes",
quantitative = quant,
qualitative = qual, eigen.threshold = NULL)
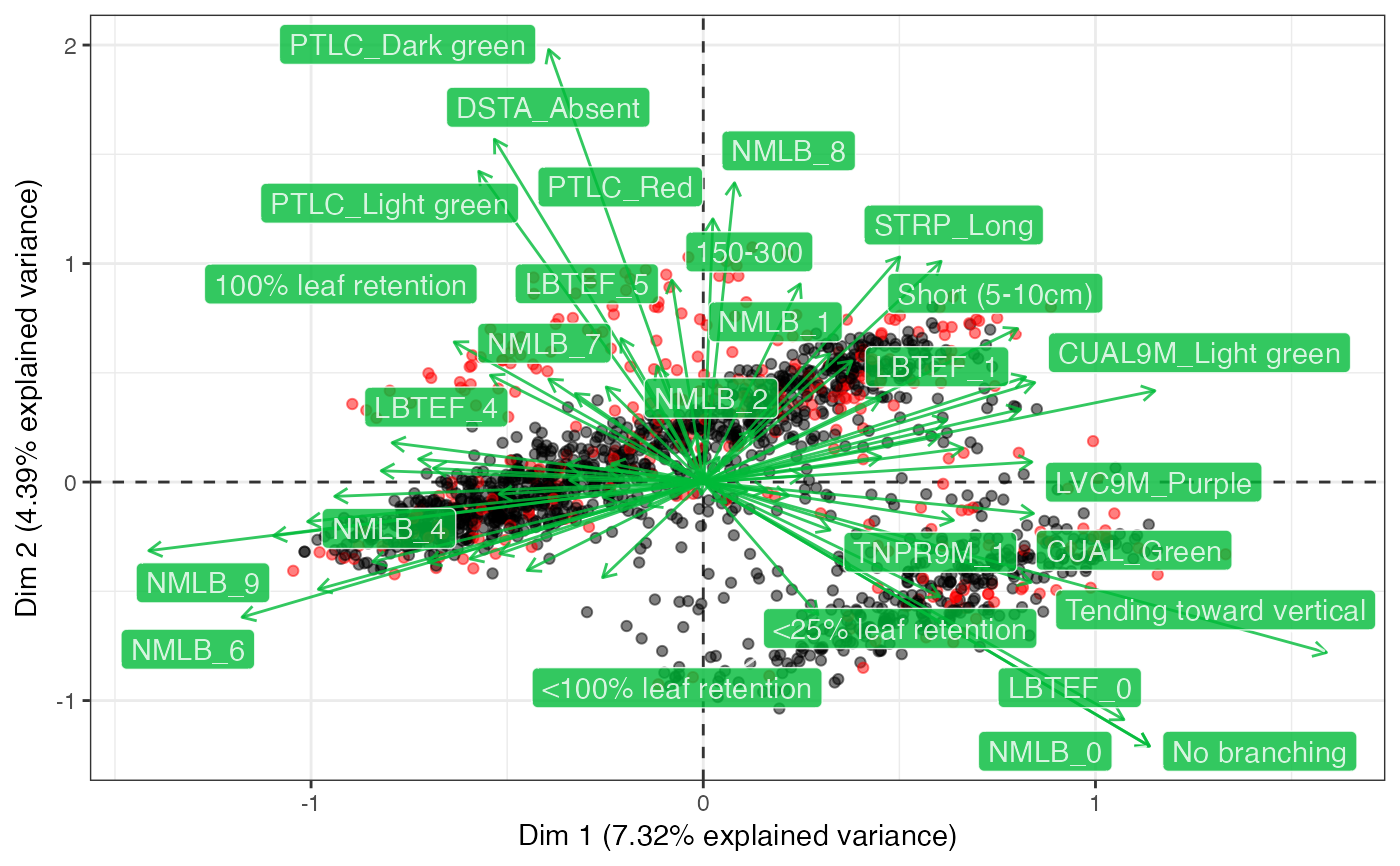
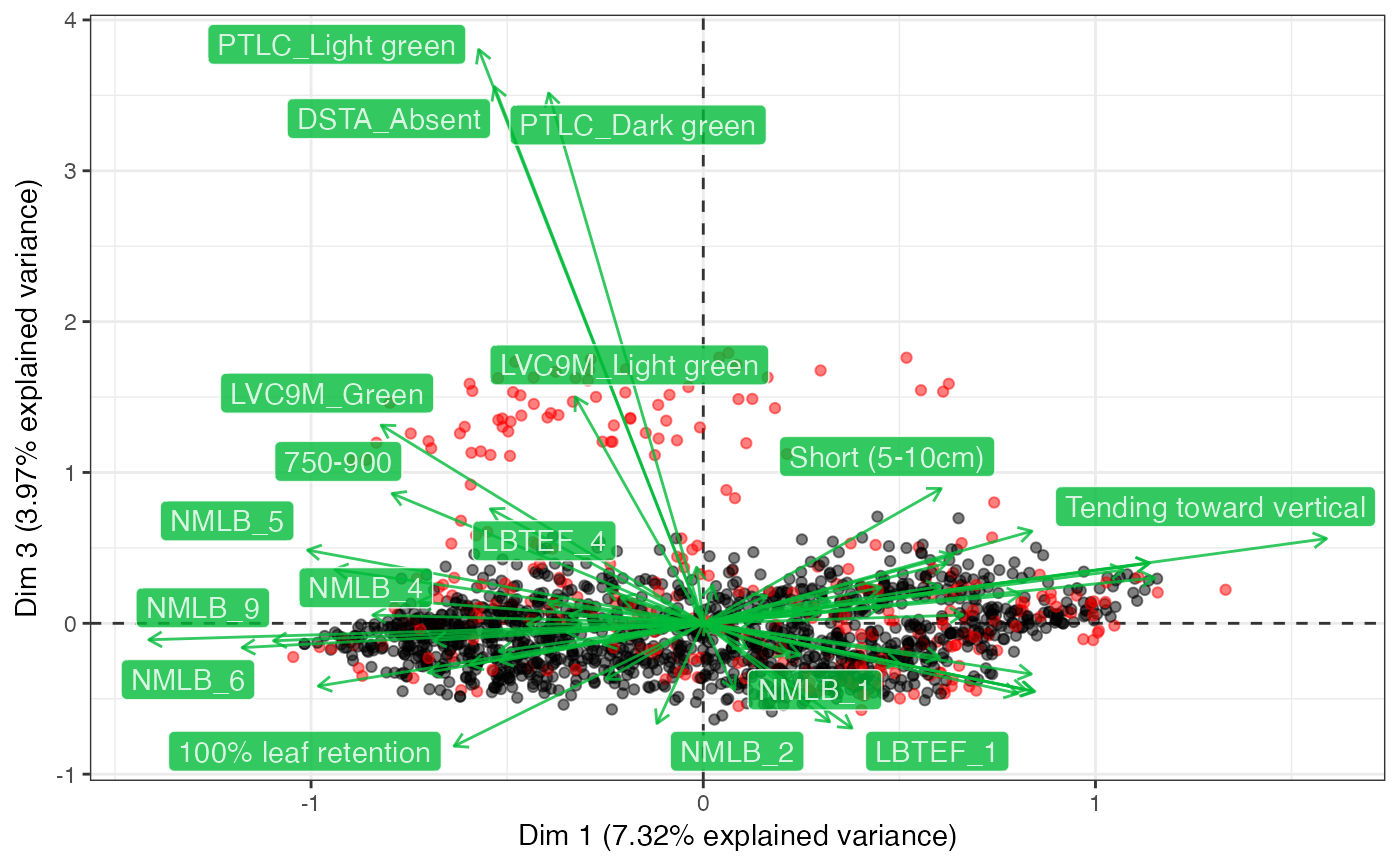
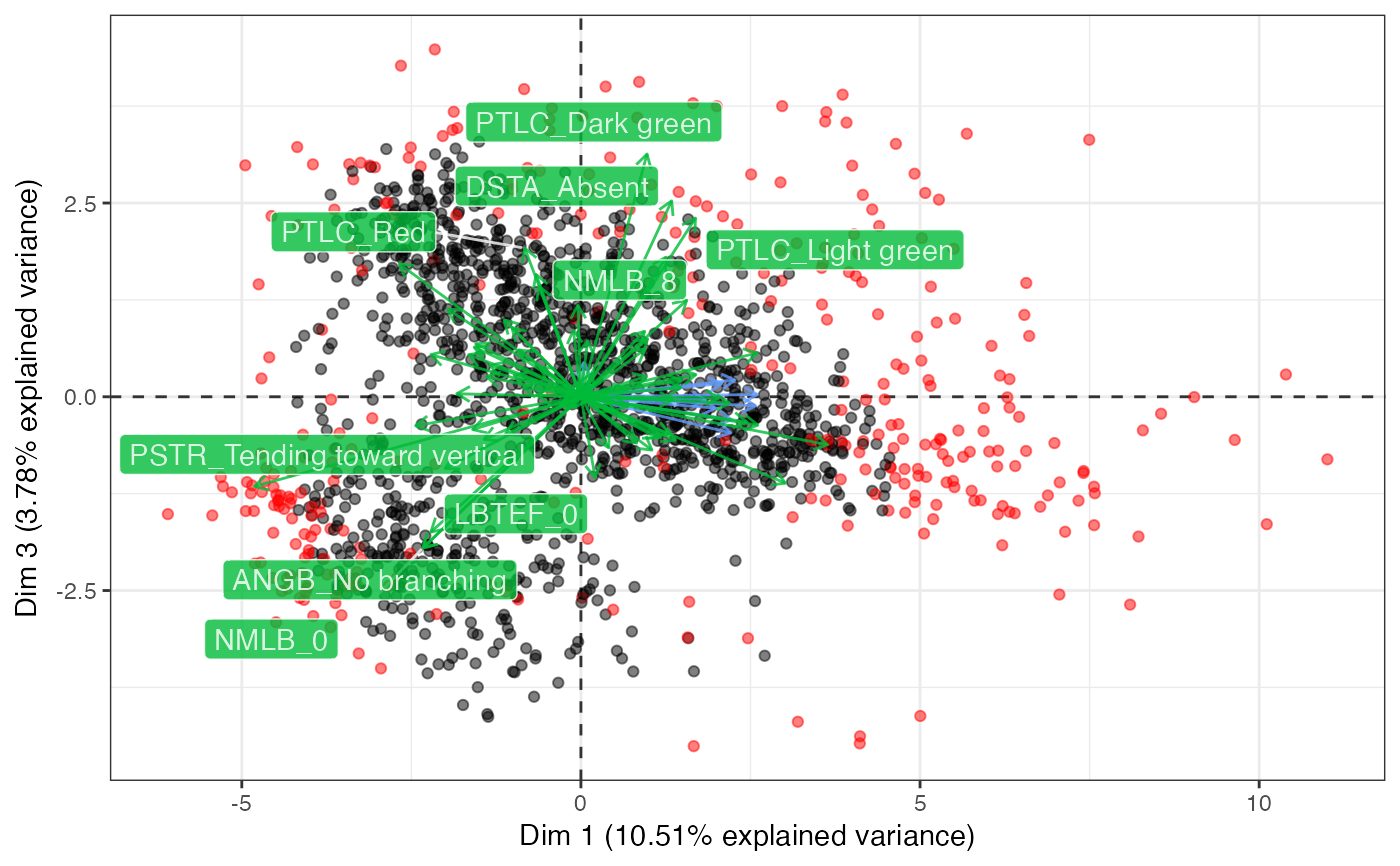
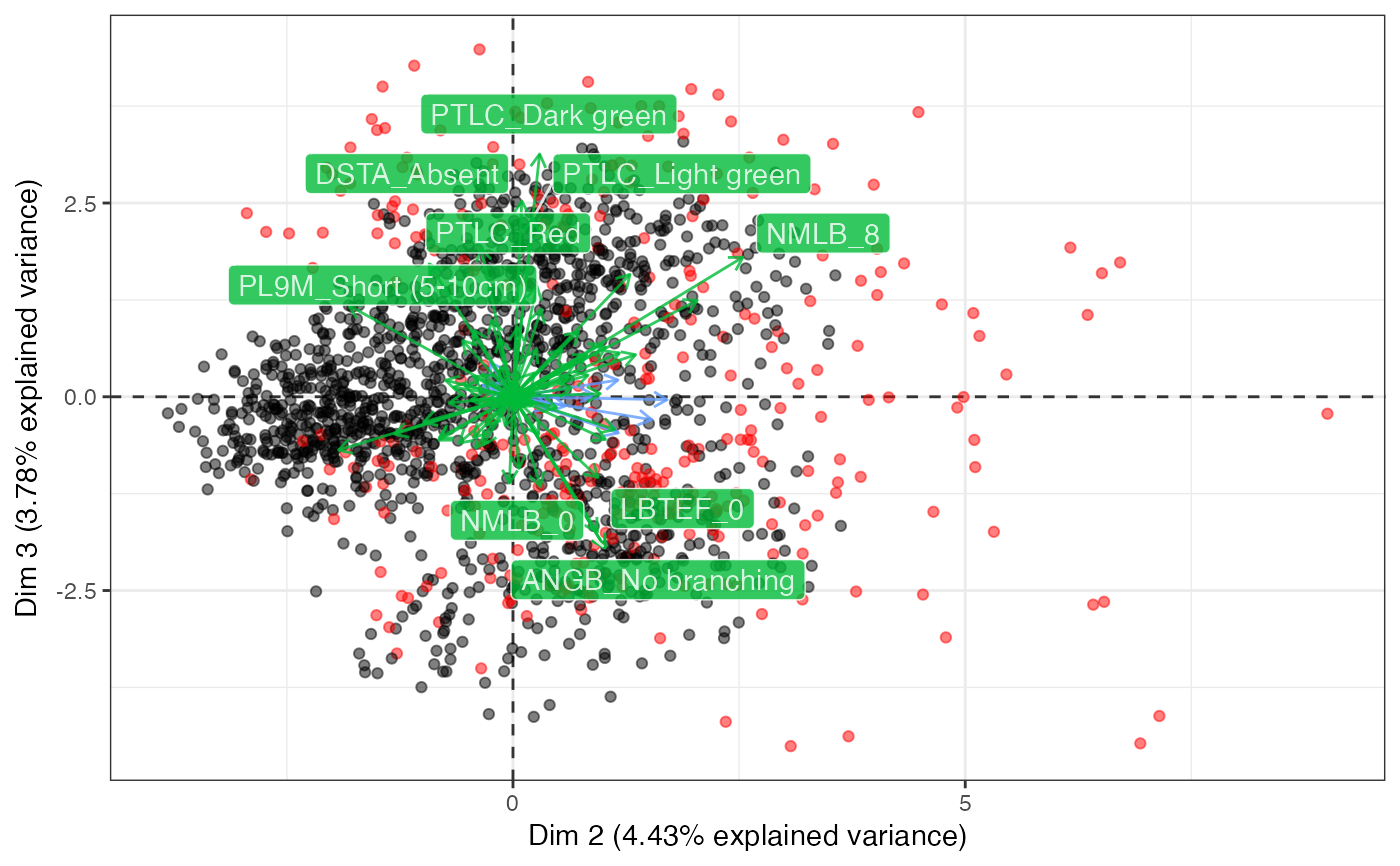
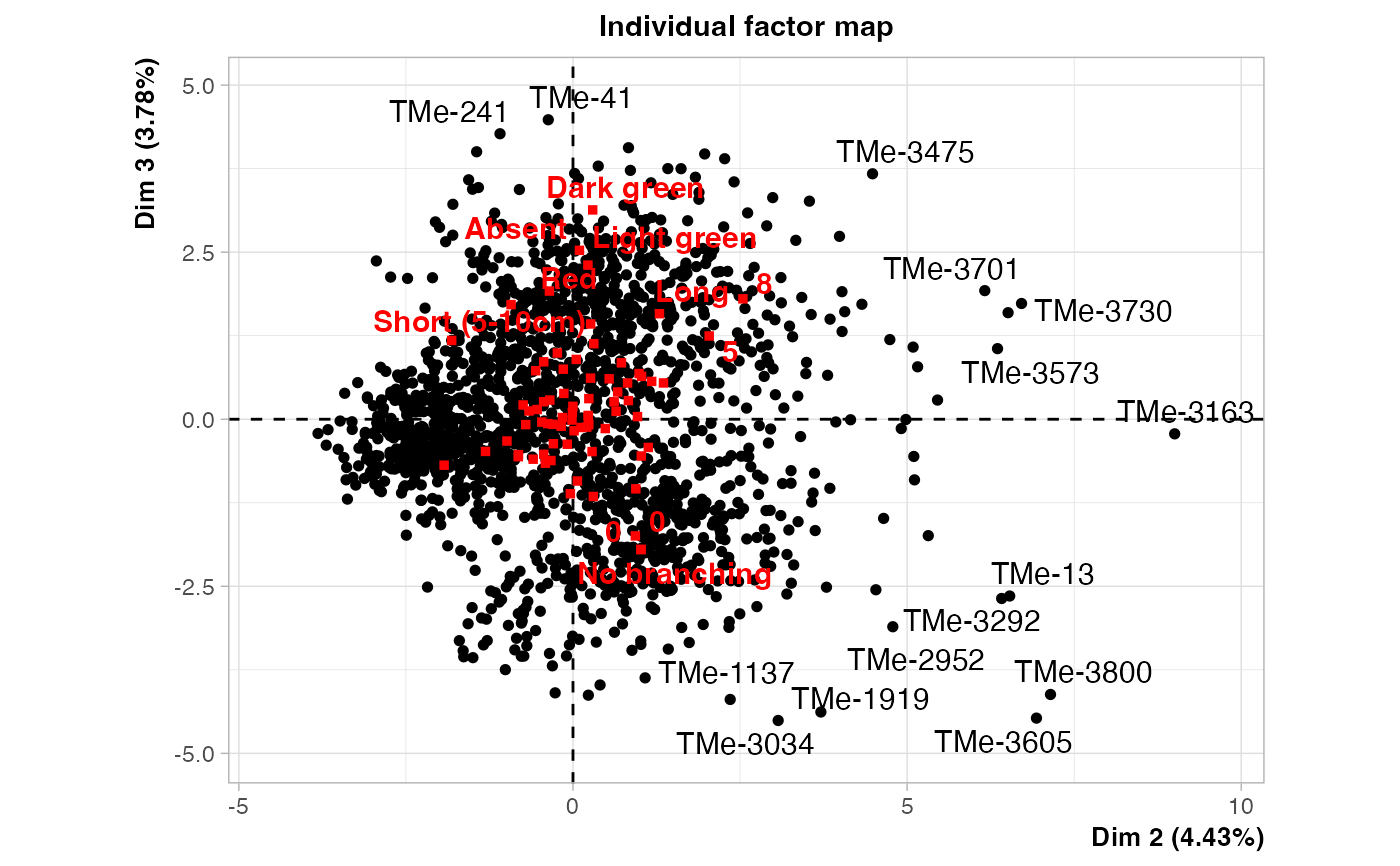
# Plot biplot
biplot(out3, ndim = 3, highlight.core = "size",
quant.scale = 3, qual.scale = 1,
point.alpha = 0.5)
#> $`Dim 1 vs. Dim 2`
#~~~~~~~~~~~~~~~~~~~~~~~~~~~~~~~~~~~~~~~~~~~~~~~~~~~~~~~~~~~~~~~~~~~~~~~~~~~~
# Get core sets with PCSS (quantitative and qualitative data)
#~~~~~~~~~~~~~~~~~~~~~~~~~~~~~~~~~~~~~~~~~~~~~~~~~~~~~~~~~~~~~~~~~~~~~~~~~~~~
out3 <- pcss.core(data = data, names = "Genotypes",
quantitative = quant,
qualitative = qual, eigen.threshold = NULL)
# Plot biplot
biplot(out3, ndim = 3, highlight.core = "size",
quant.scale = 3, qual.scale = 1,
point.alpha = 0.5)
#> $`Dim 1 vs. Dim 2`
 #>
#> $`Dim 1 vs. Dim 3`
#>
#> $`Dim 1 vs. Dim 3`
 #>
#> $`Dim 2 vs. Dim 3`
#>
#> $`Dim 2 vs. Dim 3`
 #>
# Plot biplot with FactoMineR
plot(out3$raw.out, choix=c("ind"), label = "none", axes = c(1, 2))
#>
# Plot biplot with FactoMineR
plot(out3$raw.out, choix=c("ind"), label = "none", axes = c(1, 2))
 plot(out3$raw.out, choix=c("ind"), label = "none", axes = c(1, 3))
 plot(out3$raw.out, choix=c("ind"), label = "none", axes = c(2, 3))
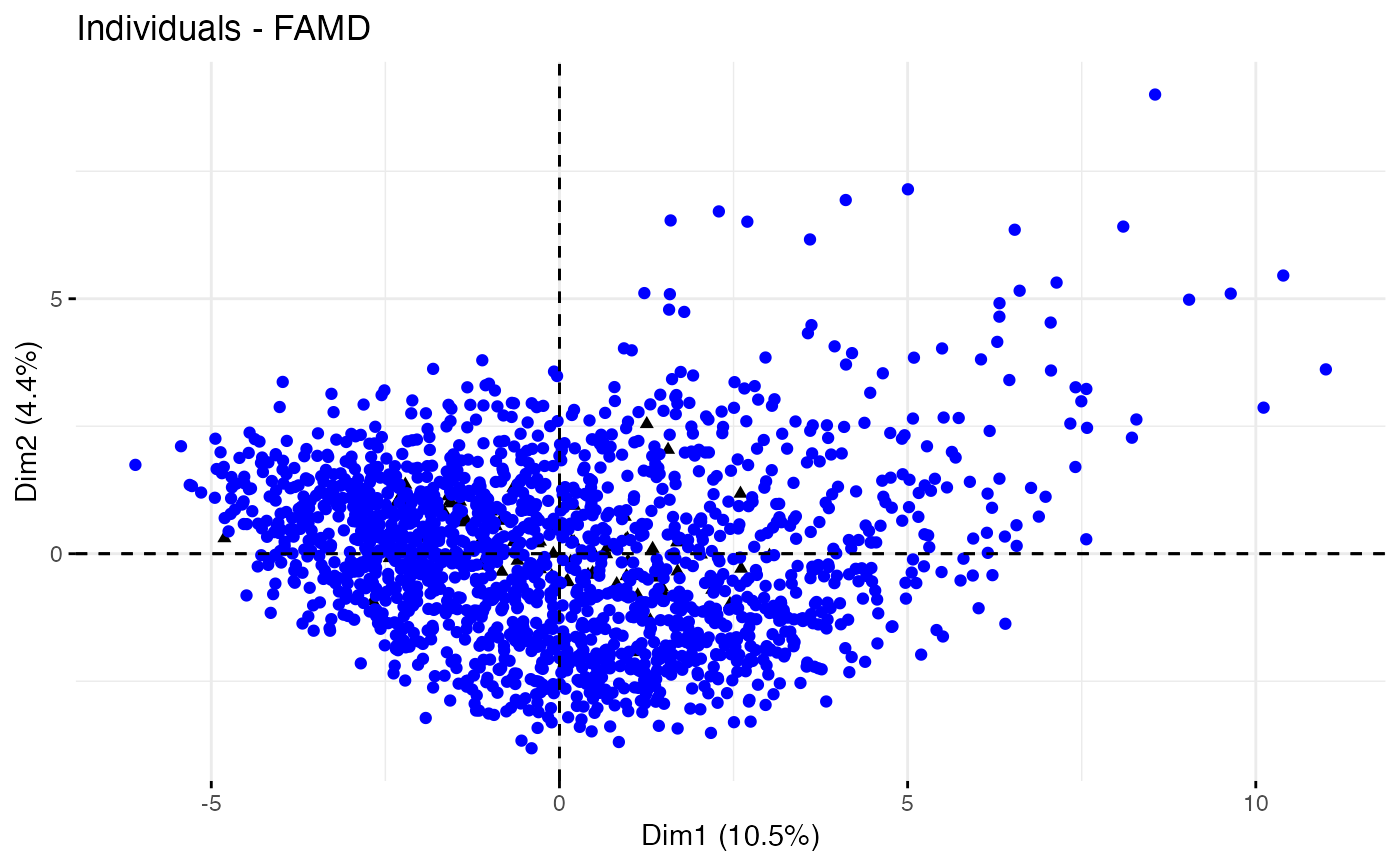
 # Plot biplot with factoextra
# Fix rownames
row.names(out3$raw.out$quali.var$coord) <-
unlist(lapply(seq_along(data[, qual]),
function(i) paste(qual[i],
levels(data[, qual[i]]), sep = "_")))
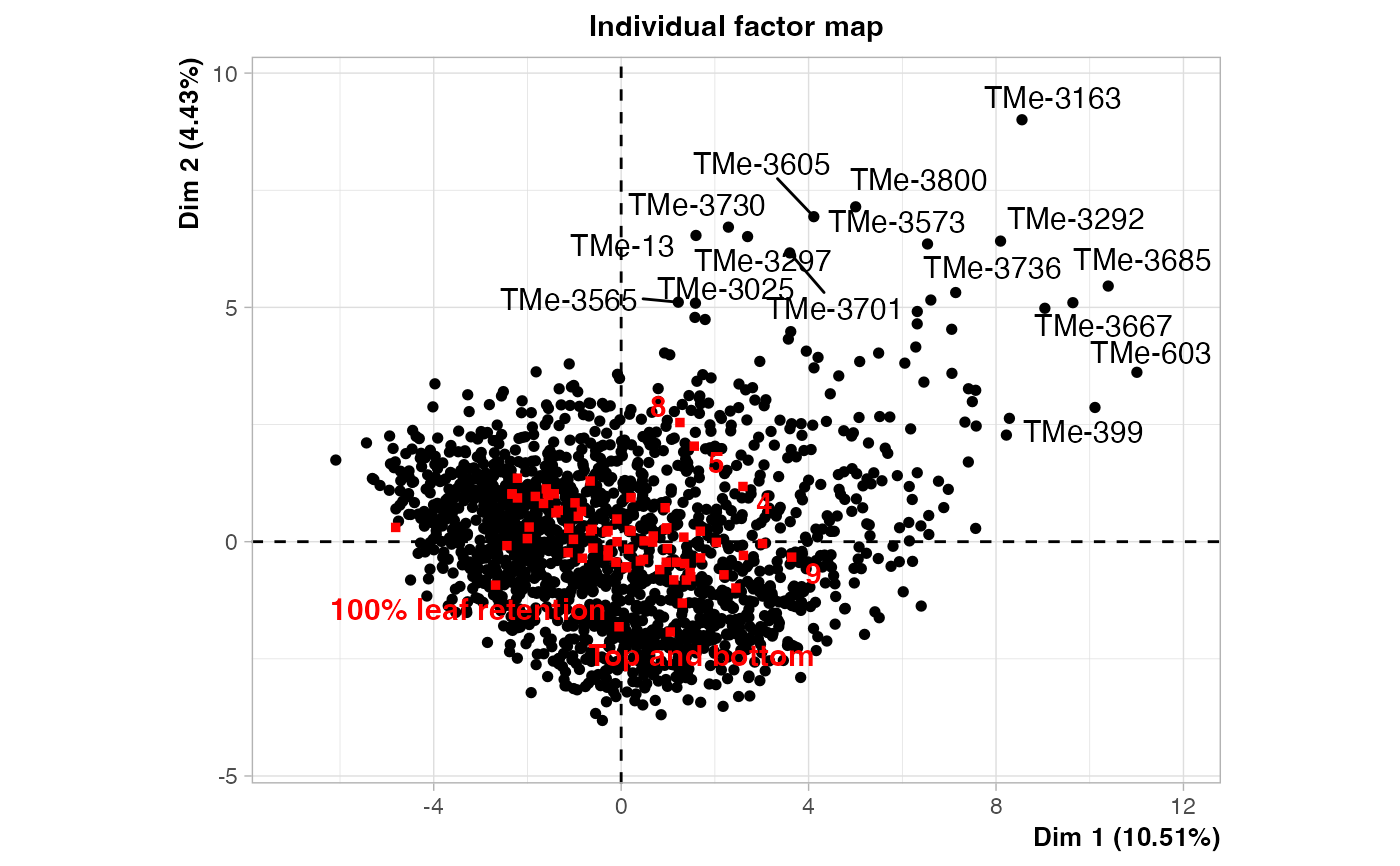
fviz_famd_ind(out3$raw.out, geom = "point", axes = c(1, 2))
# Plot biplot with factoextra
# Fix rownames
row.names(out3$raw.out$quali.var$coord) <-
unlist(lapply(seq_along(data[, qual]),
function(i) paste(qual[i],
levels(data[, qual[i]]), sep = "_")))
fviz_famd_ind(out3$raw.out, geom = "point", axes = c(1, 2))
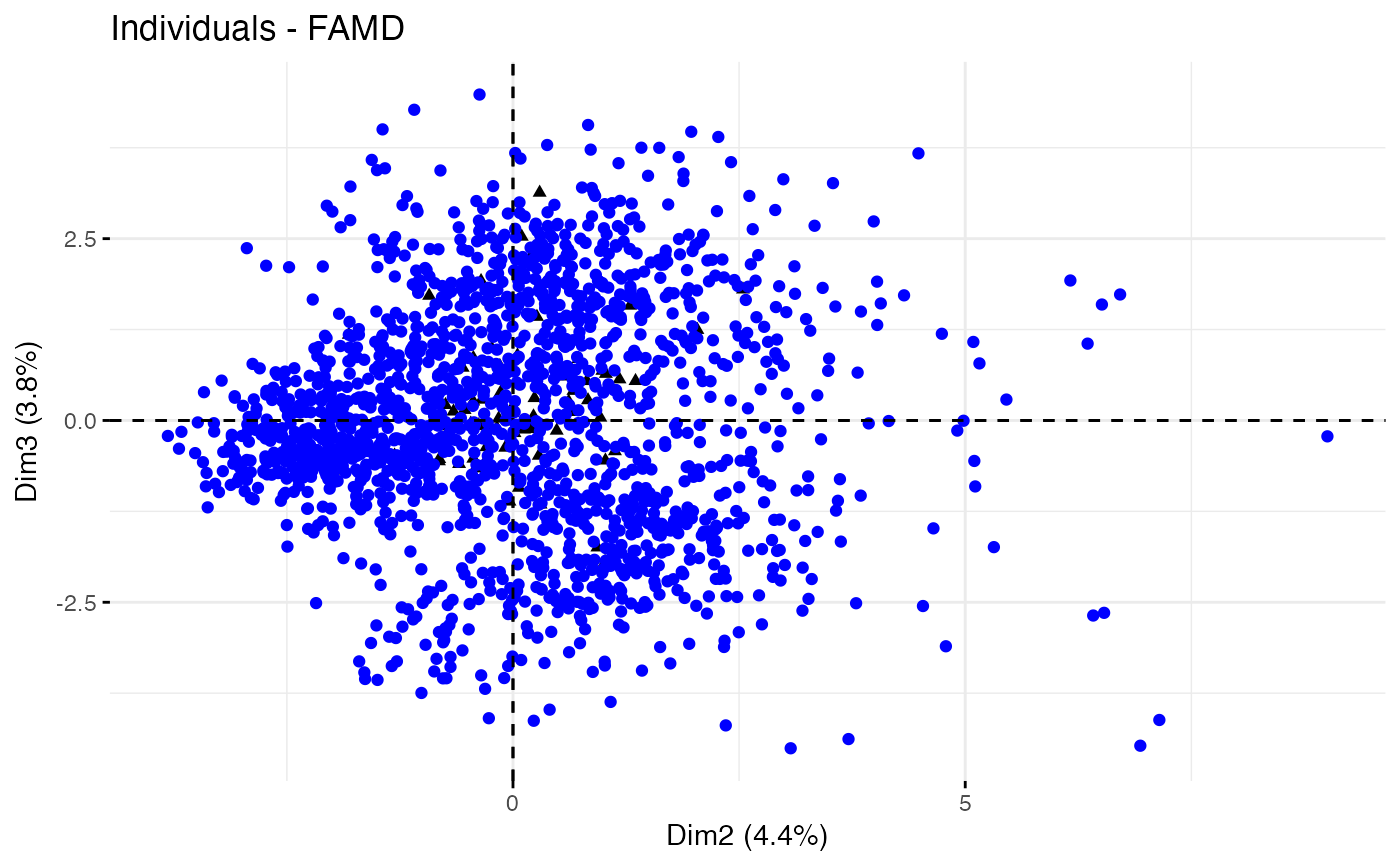
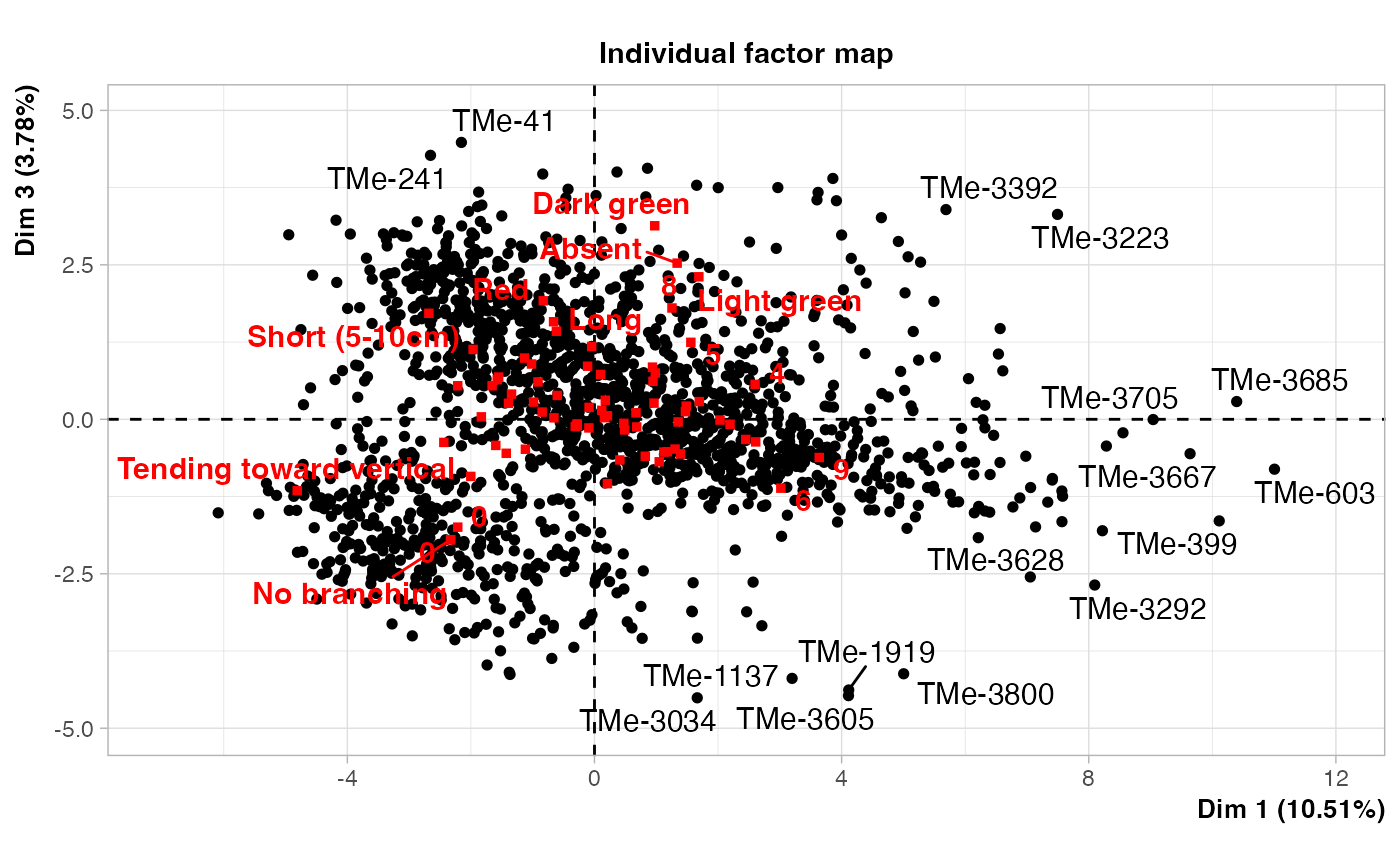
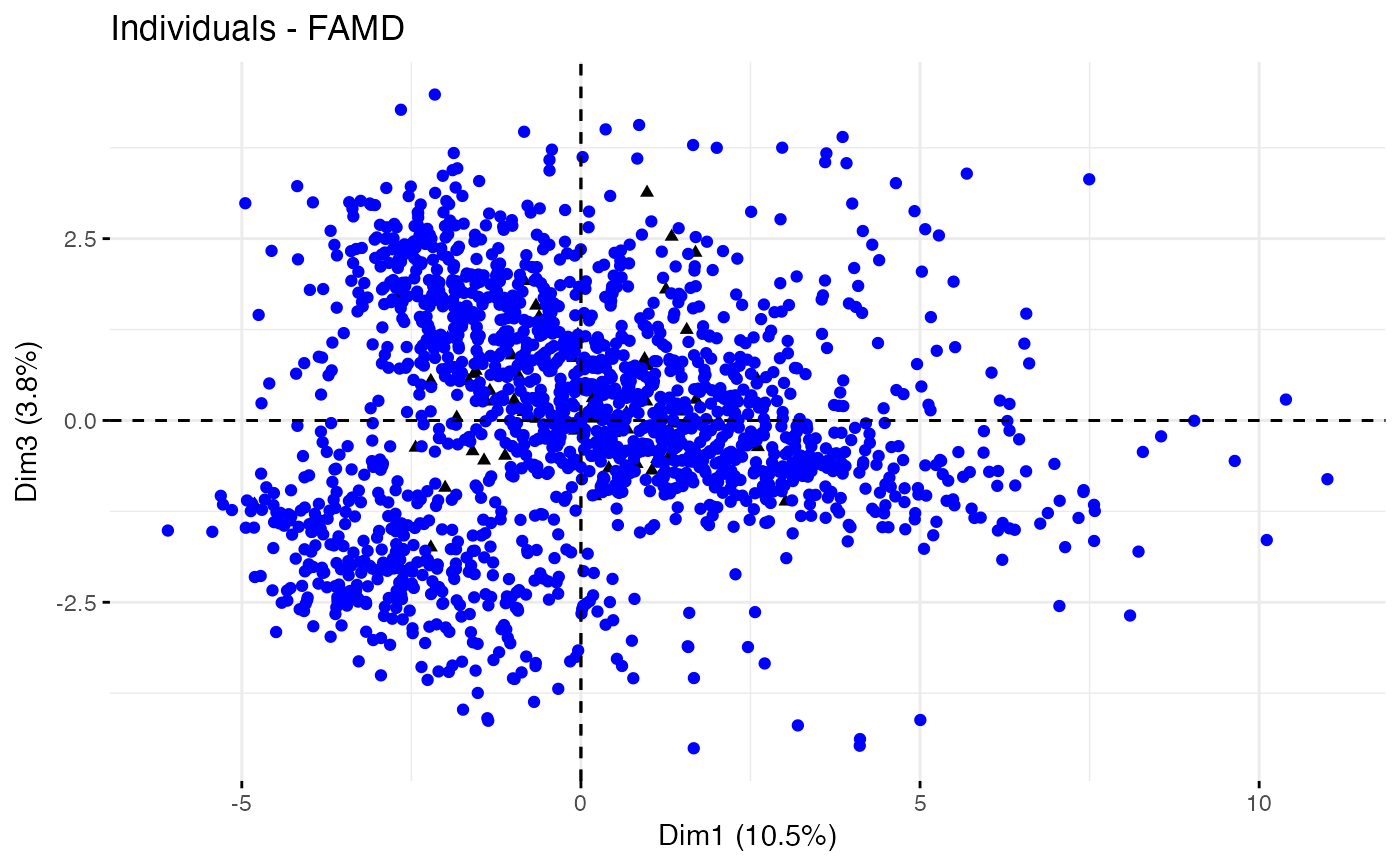
 fviz_famd_ind(out3$raw.out, geom = "point", axes = c(1, 3))
 fviz_famd_ind(out3$raw.out, geom = "point", axes = c(2, 3))