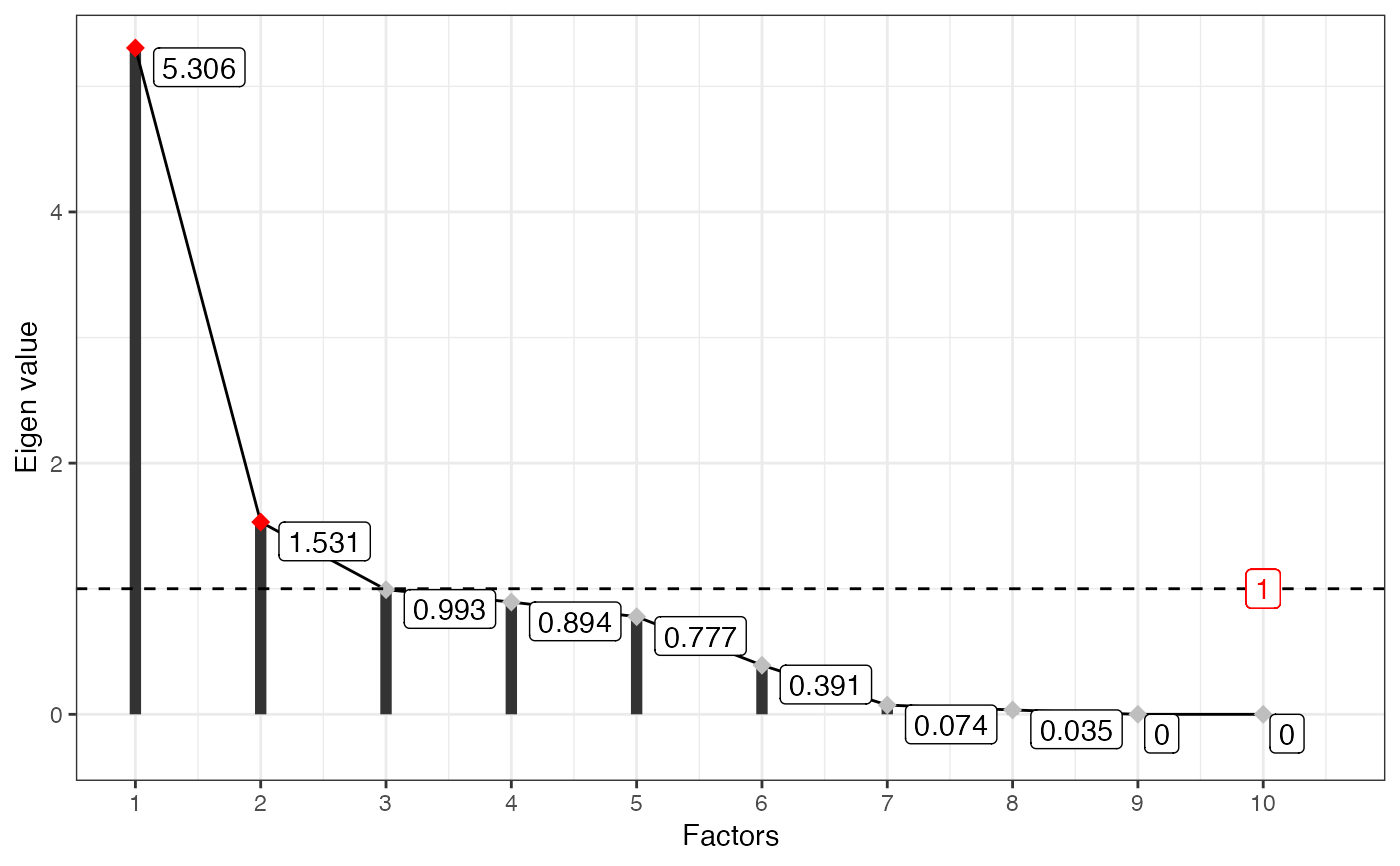
Plot Eigen values as a Scree Plot from pcss.core Output
Source: R/screeplot.pcss.core.R
screeplot.pcss.core.Rdscreeplot.pcss.core generates a scree plot of eigen values from the
output of pcss.core.
Usage
# S3 method for class 'pcss.core'
screeplot(x, ndim = NULL, show.values = TRUE, ...)Examples
#~~~~~~~~~~~~~~~~~~~~~~~~~~~~~~~~~~~~~~~~~~~~~~~~~~~~~~~~~~~~~~~~~~~~~~~~~~~~
# Prepare example data
#~~~~~~~~~~~~~~~~~~~~~~~~~~~~~~~~~~~~~~~~~~~~~~~~~~~~~~~~~~~~~~~~~~~~~~~~~~~~

if (requireNamespace('EvaluateCore', quietly = TRUE) &
    requireNamespace("factoextra", quietly = TRUE)) {

  # Get data from EvaluateCore

  data("cassava_EC", package = "EvaluateCore")
  data = cbind(Genotypes = rownames(cassava_EC), cassava_EC)
  quant <- c("NMSR", "TTRN", "TFWSR", "TTRW", "TFWSS", "TTSW", "TTPW", "AVPW",
             "ARSR", "SRDM")
  qual <- c("CUAL", "LNGS", "PTLC", "DSTA", "LFRT", "LBTEF", "CBTR", "NMLB",
            "ANGB", "CUAL9M", "LVC9M", "TNPR9M", "PL9M", "STRP", "STRC",
            "PSTR")
  rownames(data) <- NULL

  # Convert qualitative data columns to factor
  data[, qual] <- lapply(data[, qual], as.factor)


  library(FactoMineR)
  suppressPackageStartupMessages(library(factoextra))

#~~~~~~~~~~~~~~~~~~~~~~~~~~~~~~~~~~~~~~~~~~~~~~~~~~~~~~~~~~~~~~~~~~~~~~~~~~~~
# With quantitative data
#~~~~~~~~~~~~~~~~~~~~~~~~~~~~~~~~~~~~~~~~~~~~~~~~~~~~~~~~~~~~~~~~~~~~~~~~~~~~

  out1 <- pcss.core(data = data, names = "Genotypes",
                    quantitative = quant,
                    qualitative = NULL, eigen.threshold = NULL, size = 0.2,
                    var.threshold = 0.75)

  # Plot scree plot
  screeplot(x = out1)

  # Plot biplot with factoextra
  fviz_screeplot(out1$raw.out)

#~~~~~~~~~~~~~~~~~~~~~~~~~~~~~~~~~~~~~~~~~~~~~~~~~~~~~~~~~~~~~~~~~~~~~~~~~~~~
# Get core sets with PCSS (qualitative data)
#~~~~~~~~~~~~~~~~~~~~~~~~~~~~~~~~~~~~~~~~~~~~~~~~~~~~~~~~~~~~~~~~~~~~~~~~~~~~

  out2 <- pcss.core(data = data, names = "Genotypes", quantitative = NULL,
                    qualitative = qual, eigen.threshold = NULL,
                    size = 0.2, var.threshold = 0.75)

  # Plot scree plot
  screeplot(x = out2)

  # Plot biplot with factoextra
  fviz_screeplot(out2$raw.out)

#~~~~~~~~~~~~~~~~~~~~~~~~~~~~~~~~~~~~~~~~~~~~~~~~~~~~~~~~~~~~~~~~~~~~~~~~~~~~
# Get core sets with PCSS (quantitative and qualitative data)
#~~~~~~~~~~~~~~~~~~~~~~~~~~~~~~~~~~~~~~~~~~~~~~~~~~~~~~~~~~~~~~~~~~~~~~~~~~~~

  out3 <- pcss.core(data = data, names = "Genotypes",
                    quantitative = quant,
                    qualitative = qual, eigen.threshold = NULL)

  # Plot scree plot
  screeplot(x = out3)

  # Plot biplot with factoextra
  fviz_screeplot(out3$raw.out)

} else {
  message('Packages "EvaluateCore" and "factoextra" are required to run these examples.')
}
#> Warning: Ignoring empty aesthetic: `width`.
