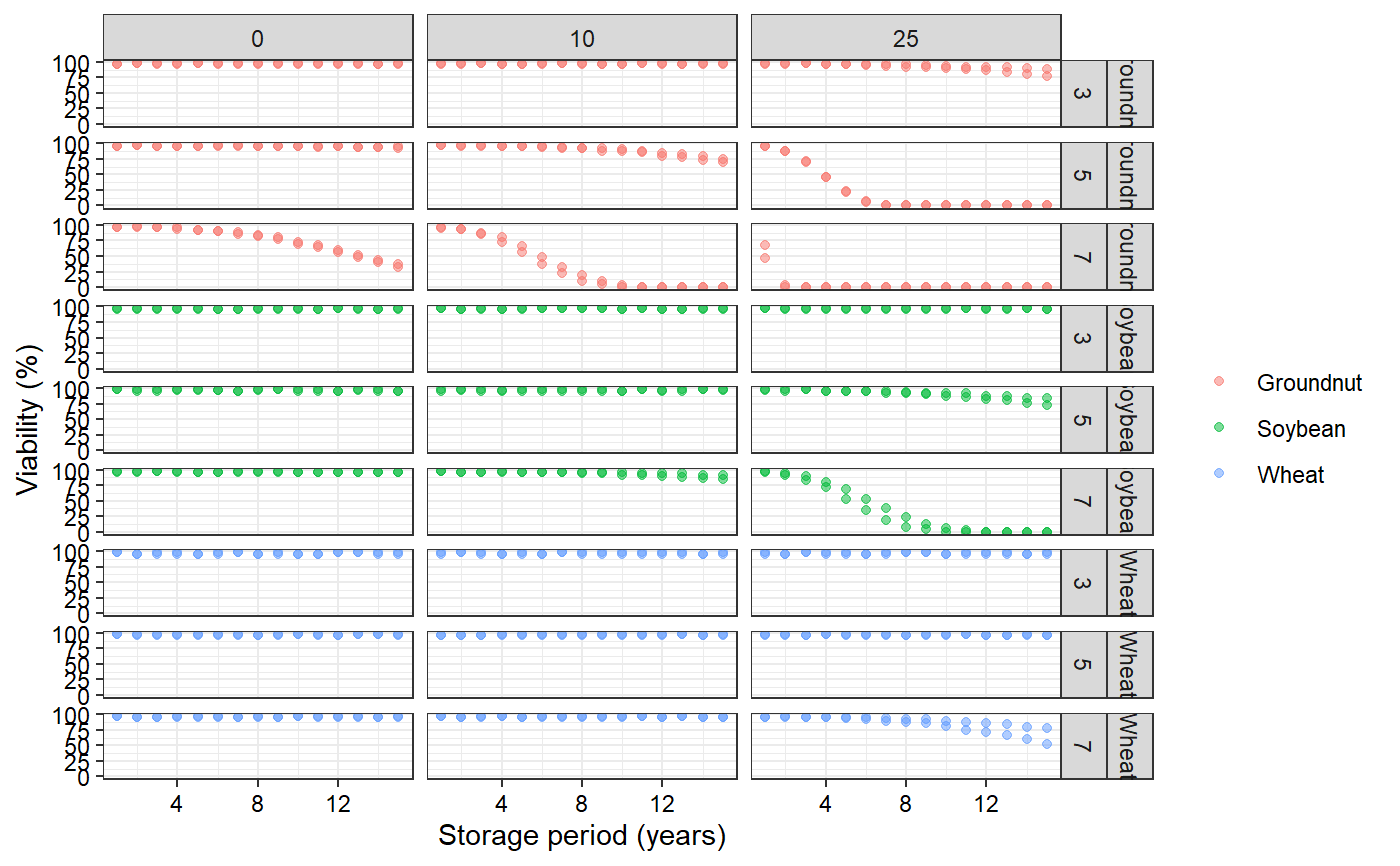
Seed survial data of three crops - groundnut, soybean and wheat stored for 15 years at combinations of three different moisture contents (3%, 5% and 7%) and temperatures (0 °C, 10 °C and 25 °C).
seedsurvival
Format
A data frame with 7 columns:
- crop
The crop name.
- moistruecontent
The moisture content (%).
- temperature
The temperature (°C).
- storageperiod
The period of storage, i.e. the year at which viability was recorded.
- rep
The replication.
- viabilitypercent
The viability percentage value recorded.
- sampsize
The sample size used for estimating viability percentage.
Details
Examples
# Load ggplot2 package
library(ggplot2)

# Plot with seedsurvival dataset with ggplot2
ggplot(data = seedsurvival, aes(x = storageperiod, y = viabilitypercent)) +
  geom_point(aes(colour = crop), alpha = 0.5) +
  labs(x = "Storage period (years)", y = "Viability (%)") +
  facet_grid(crop + moistruecontent ~ temperature) +
  theme_bw() +
  theme(axis.text = element_text(colour = "black"),
        legend.title = element_blank())
