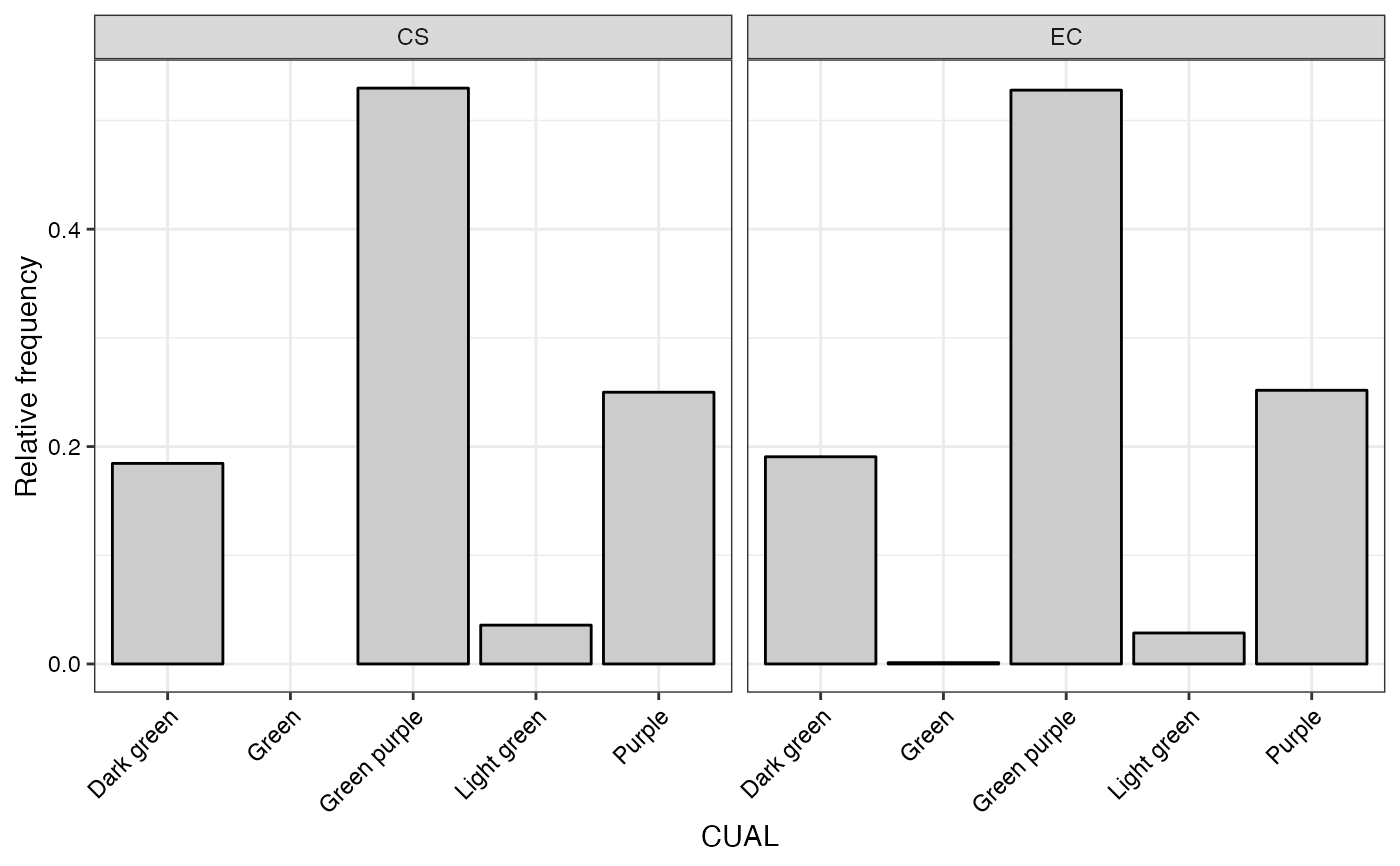
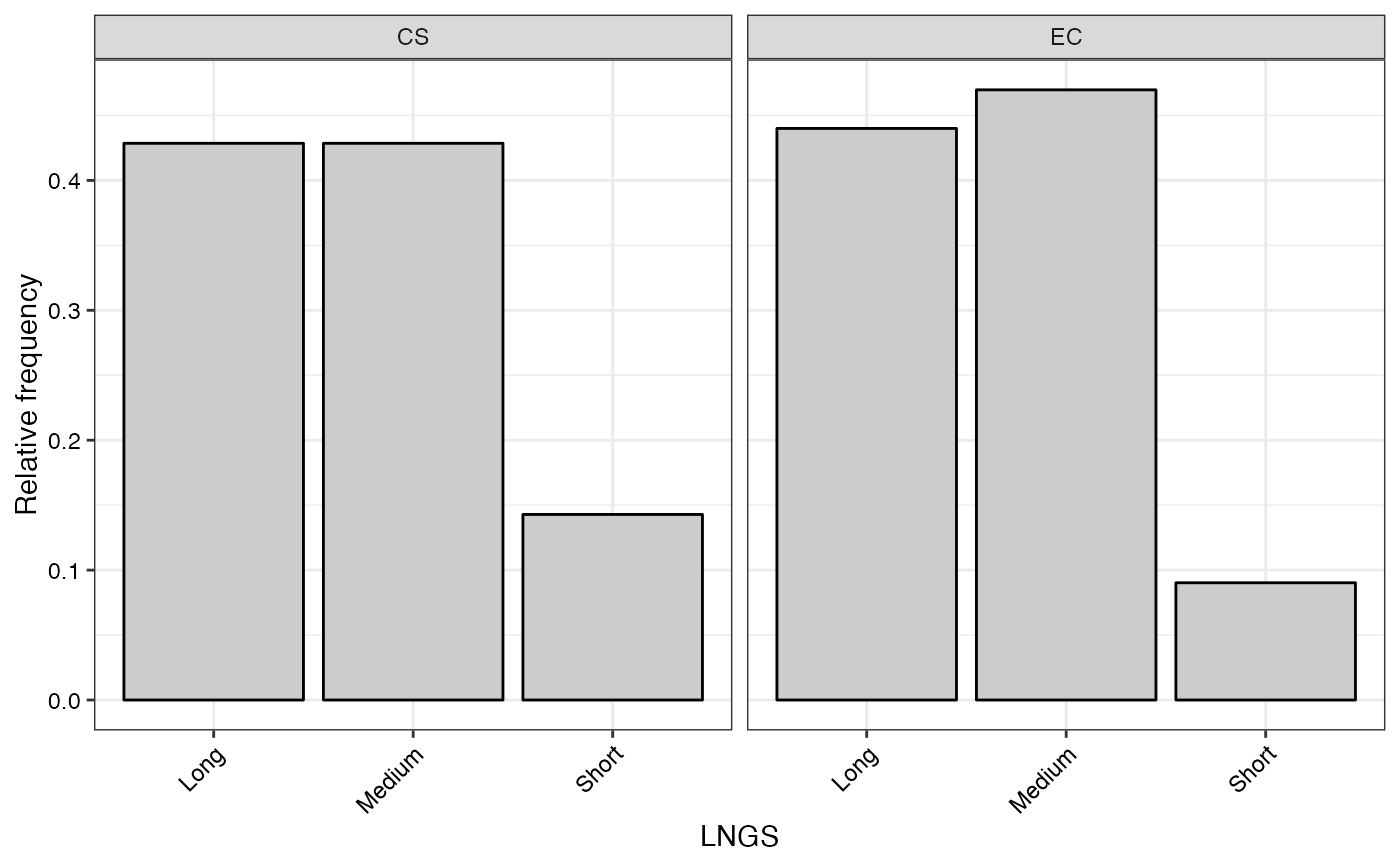
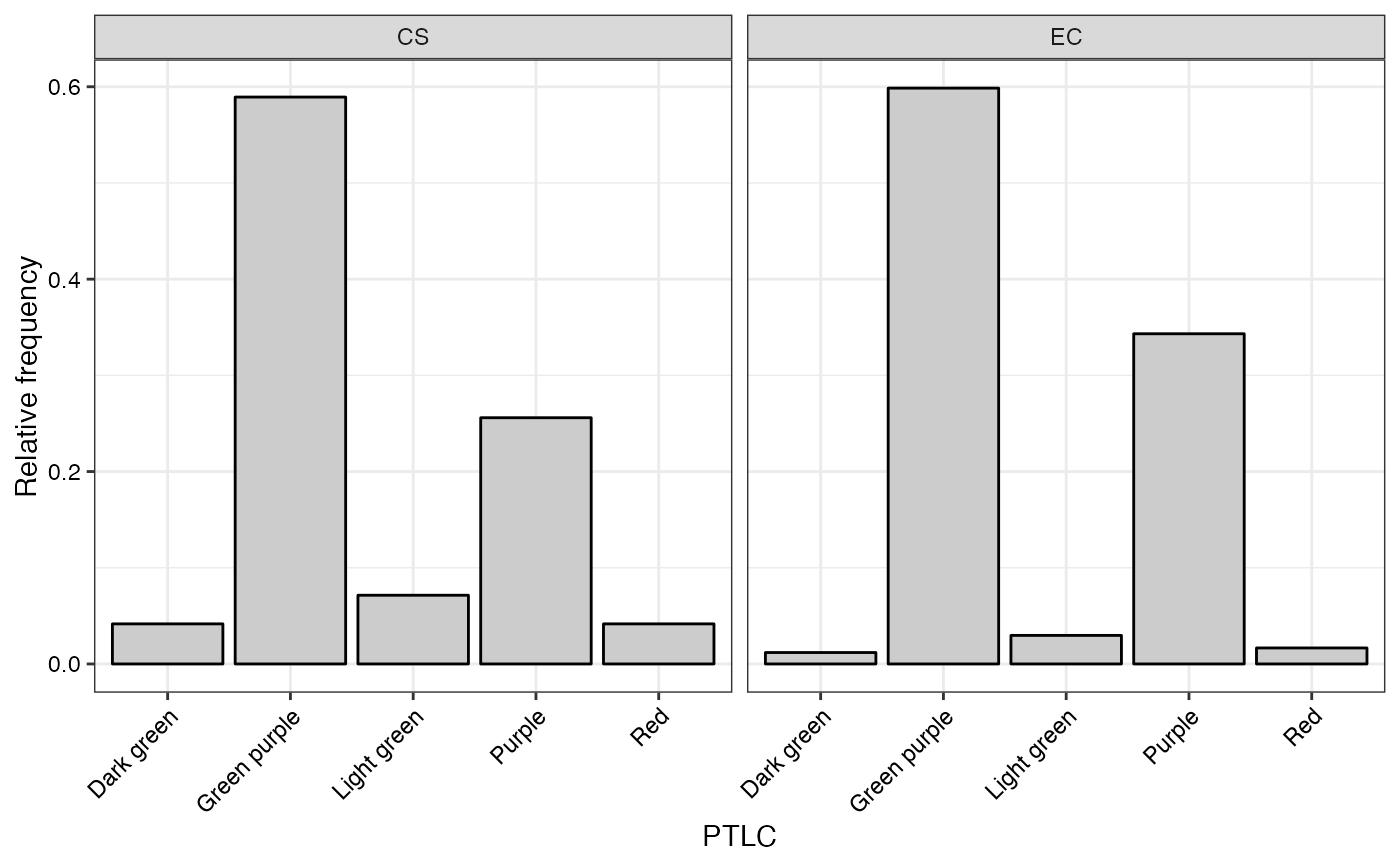
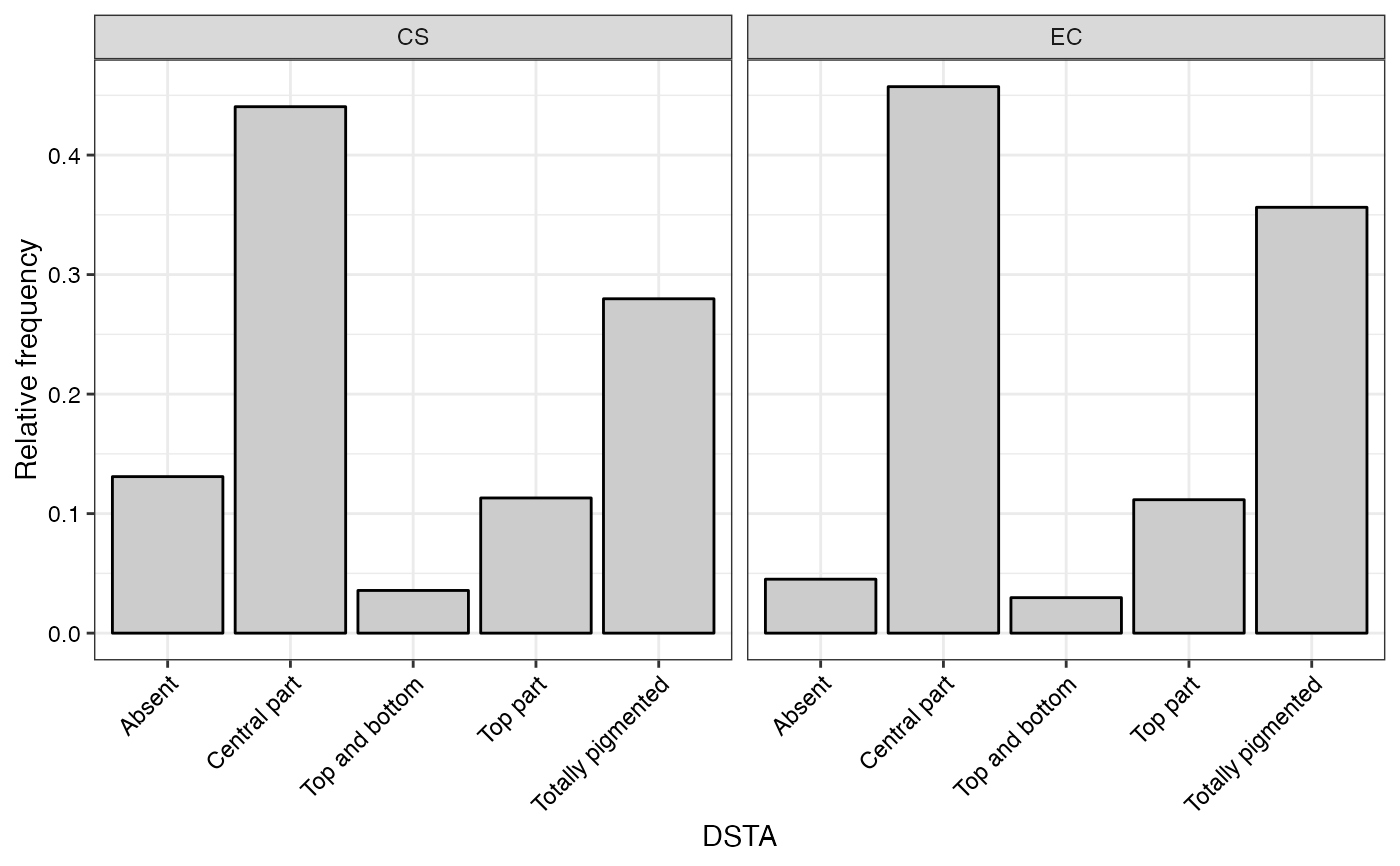
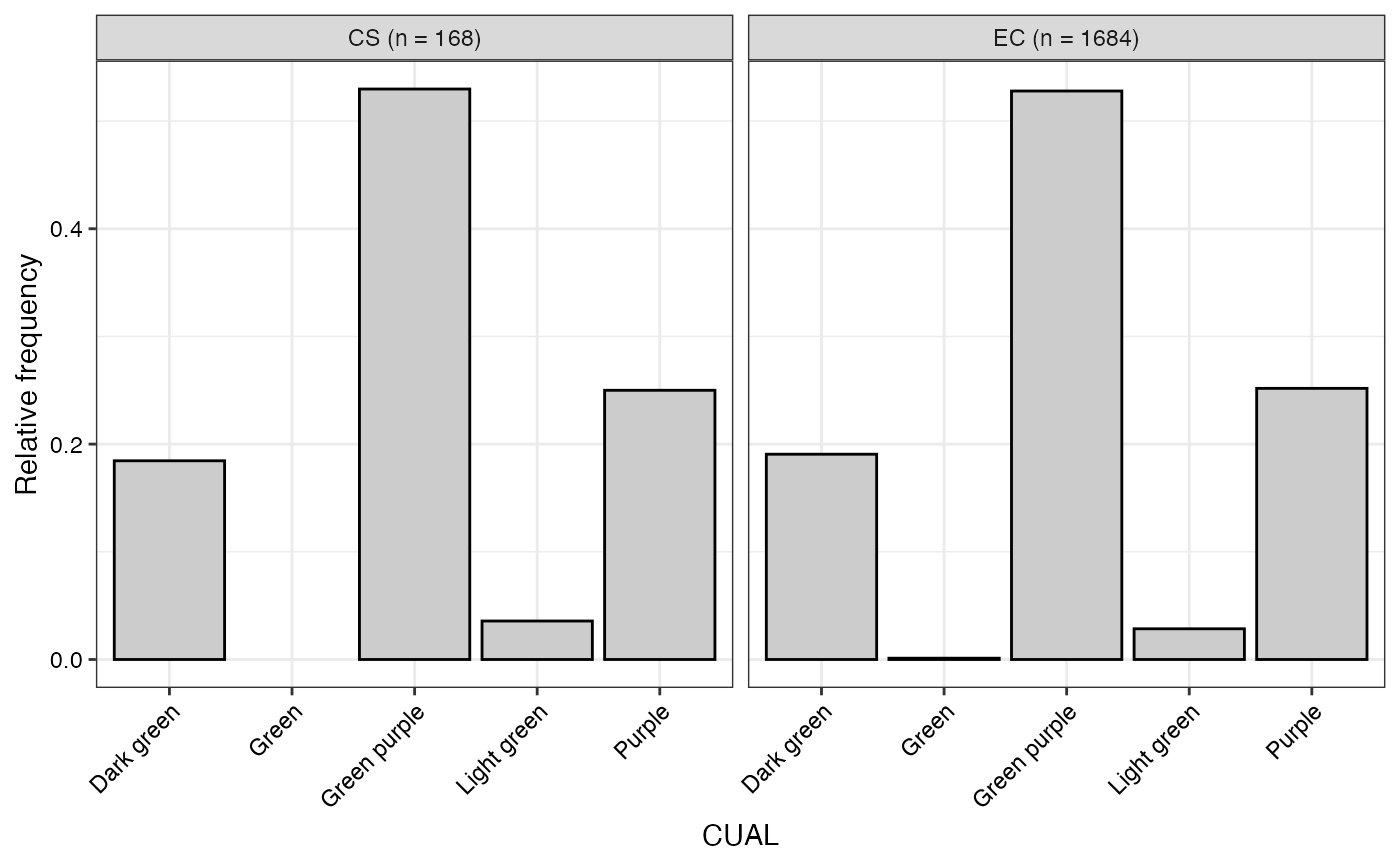
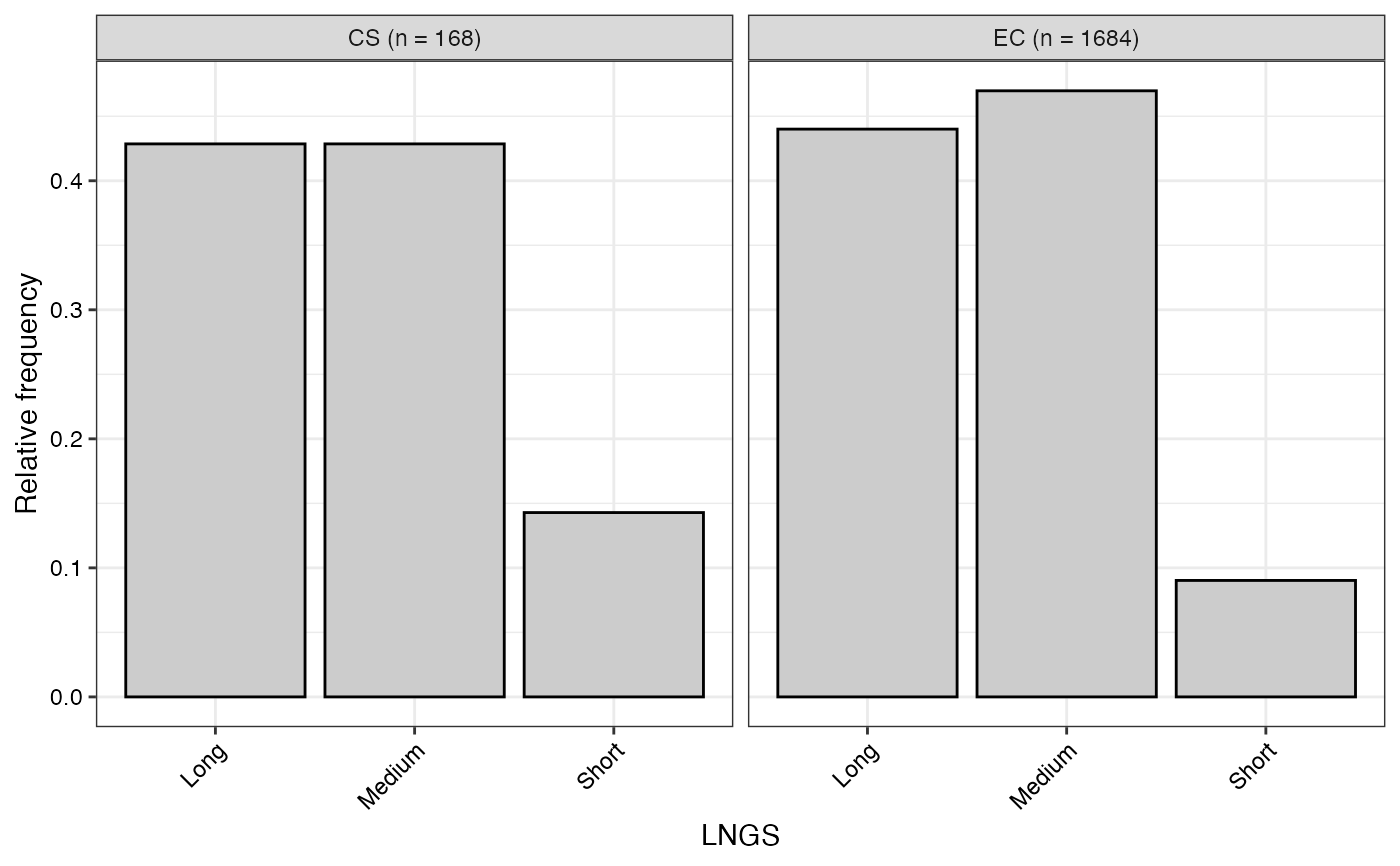
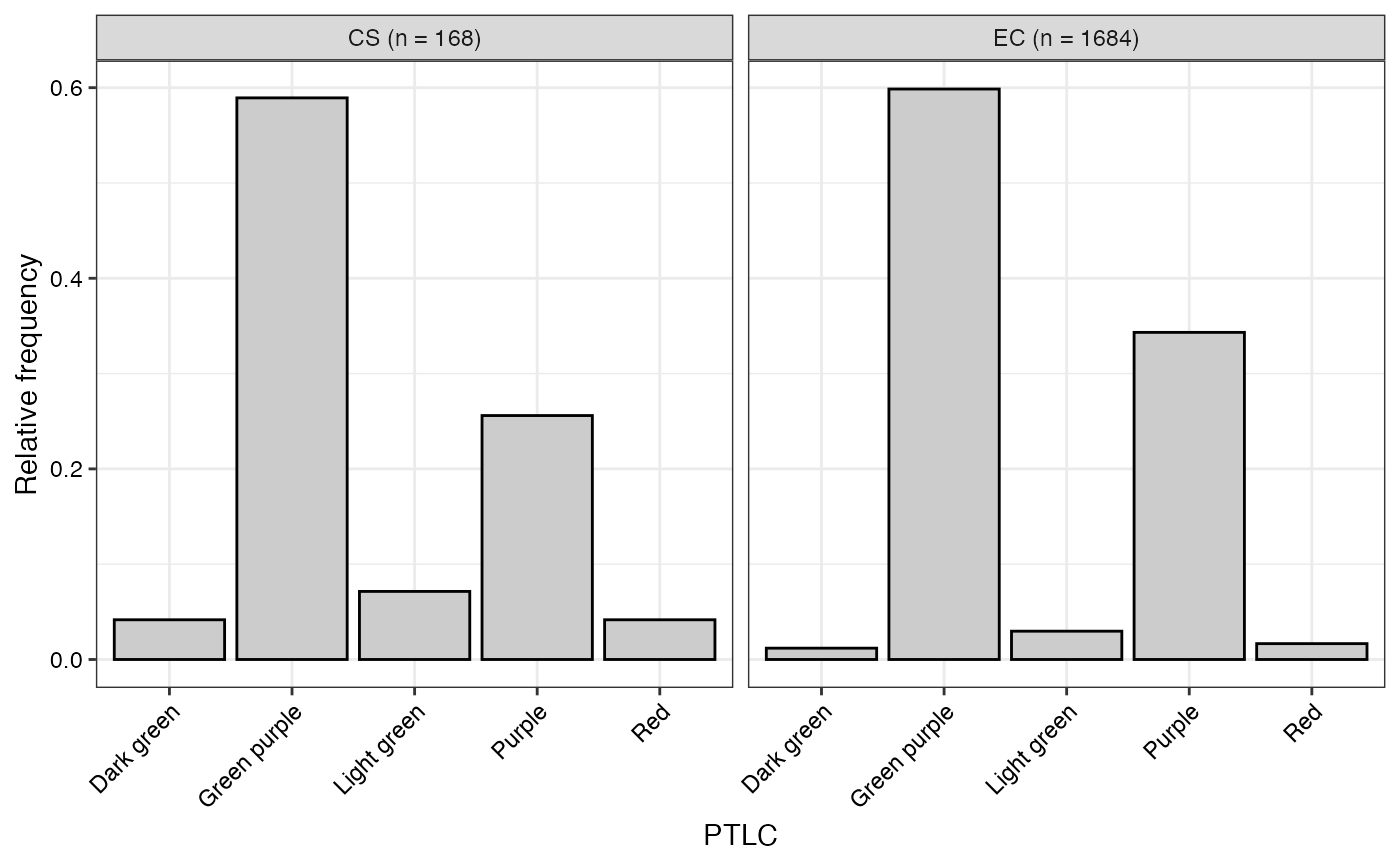
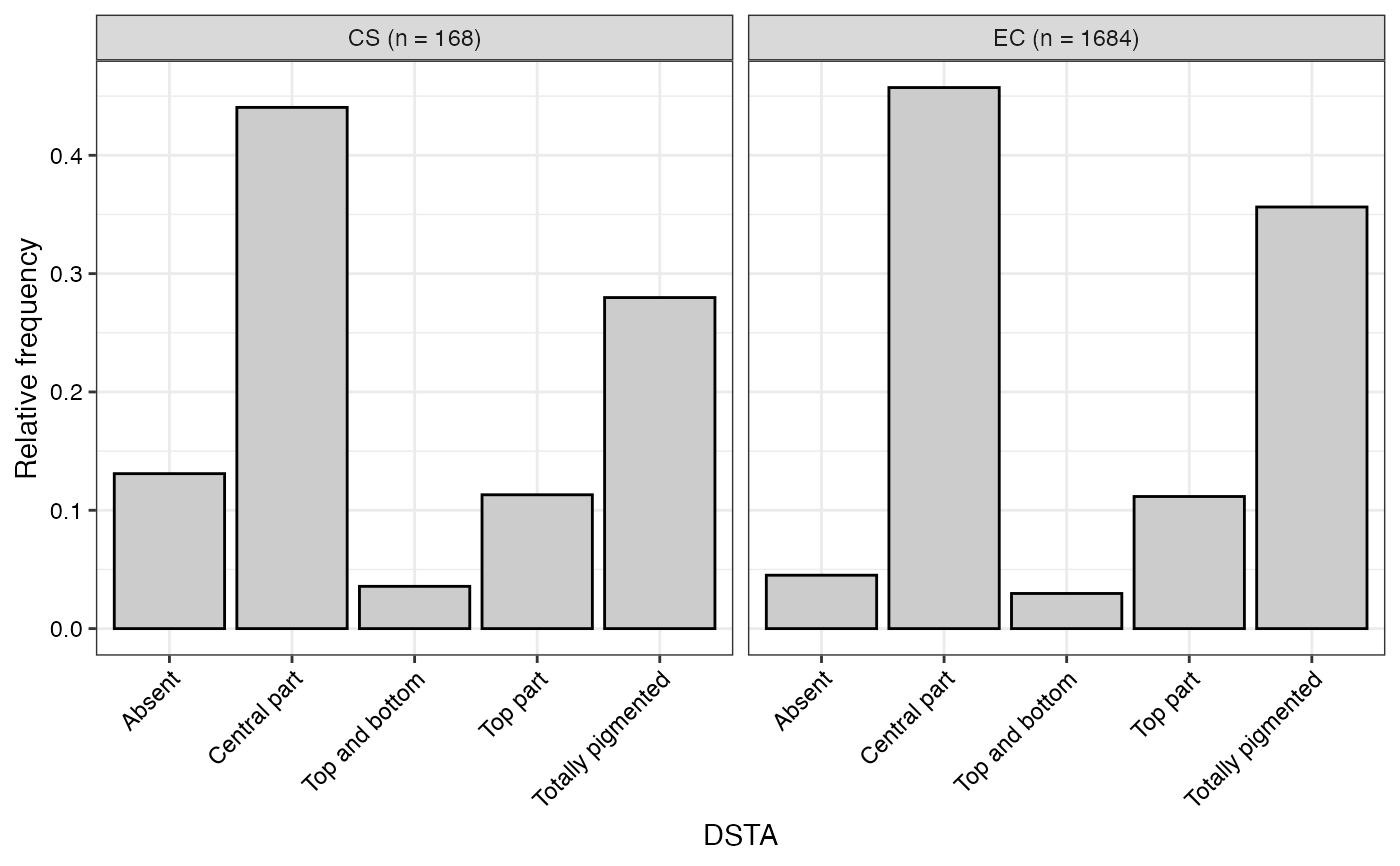
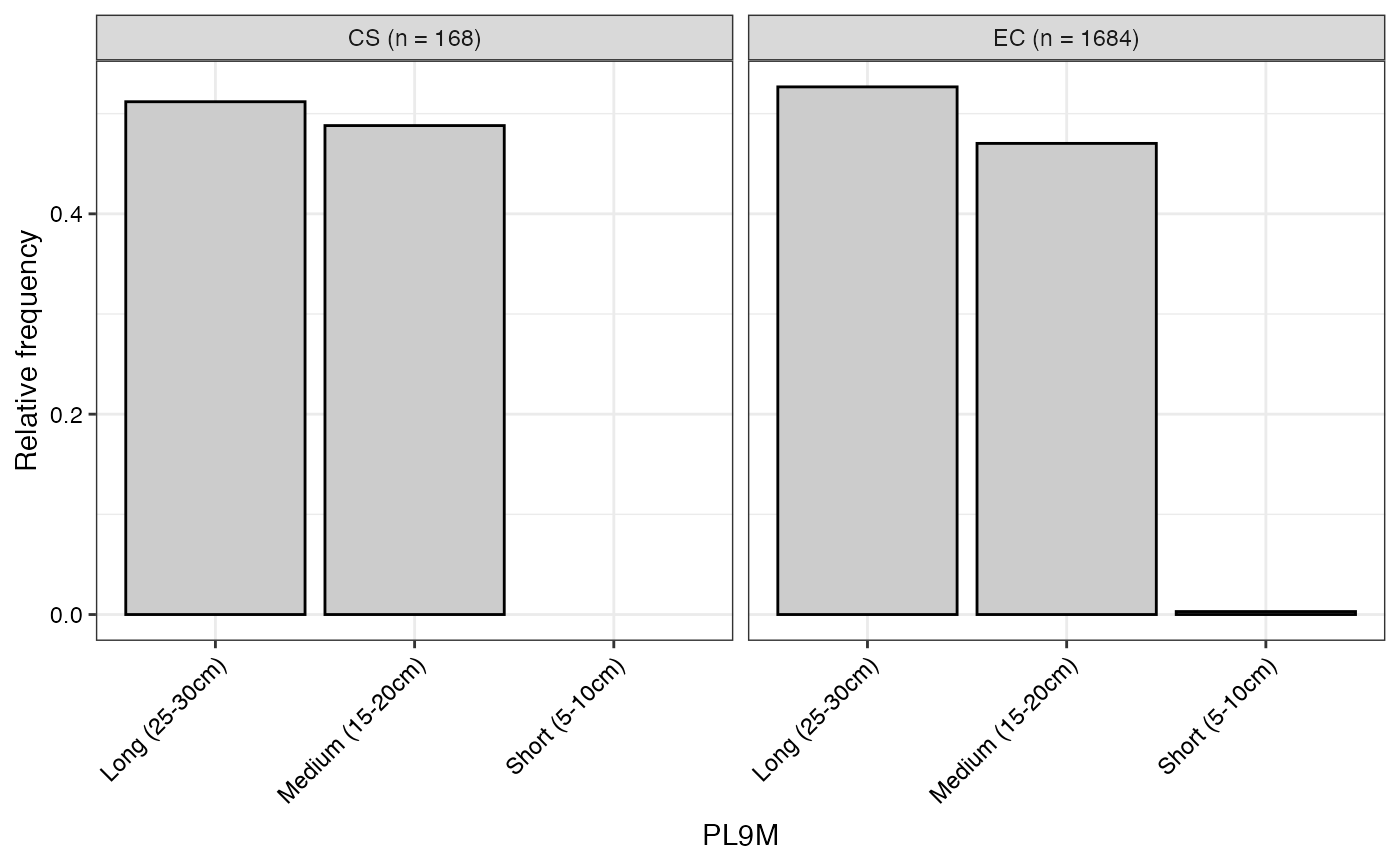
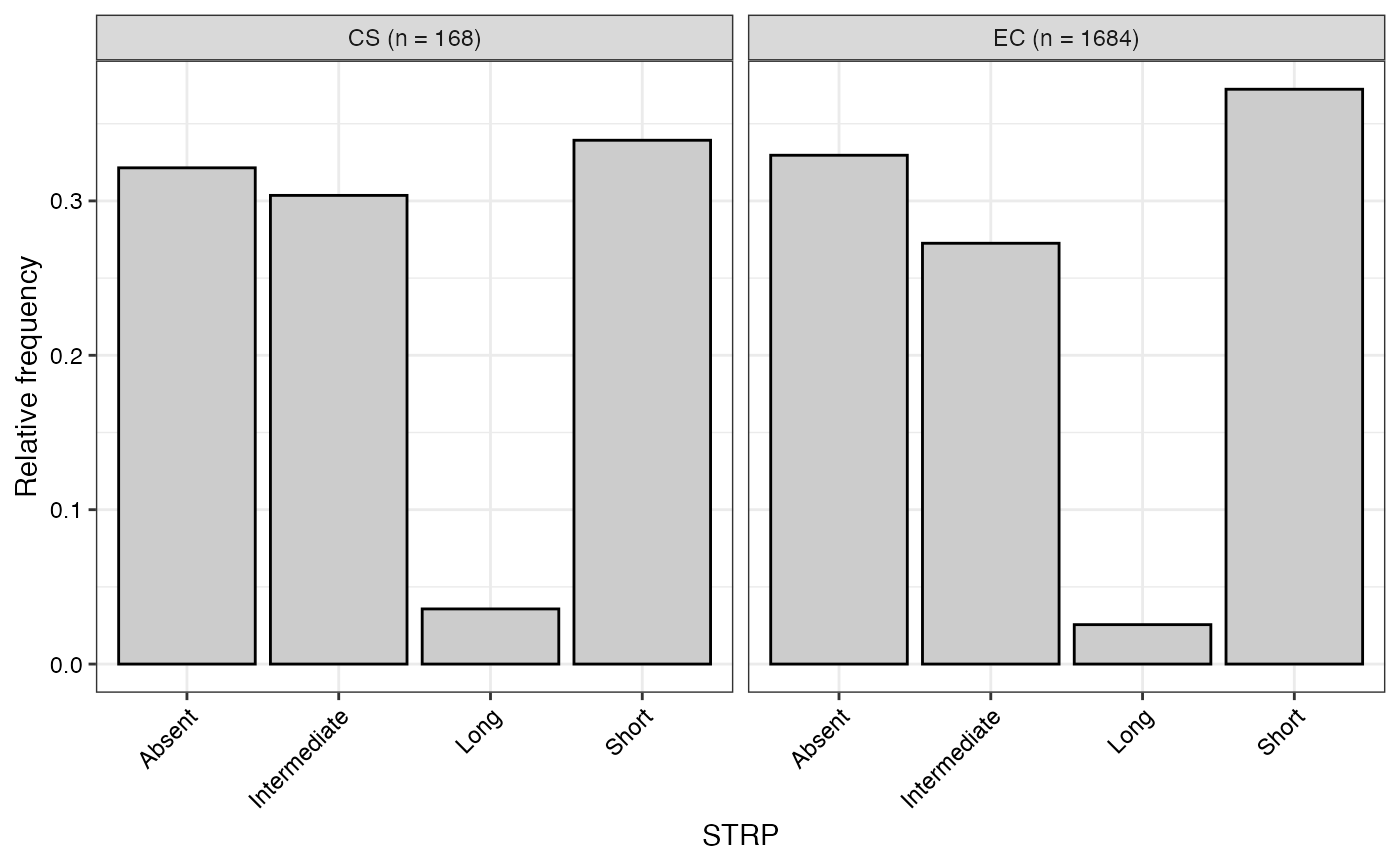
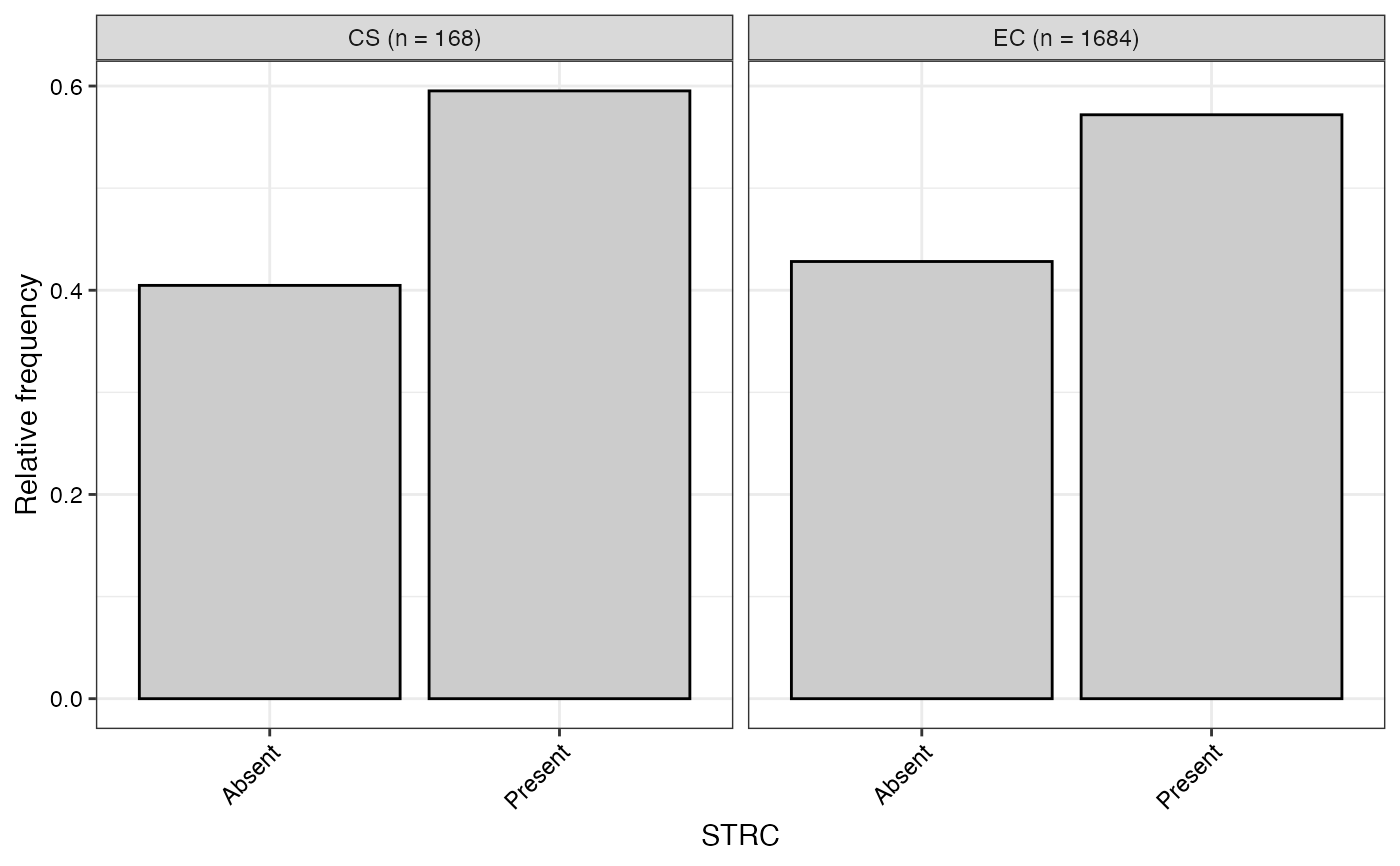
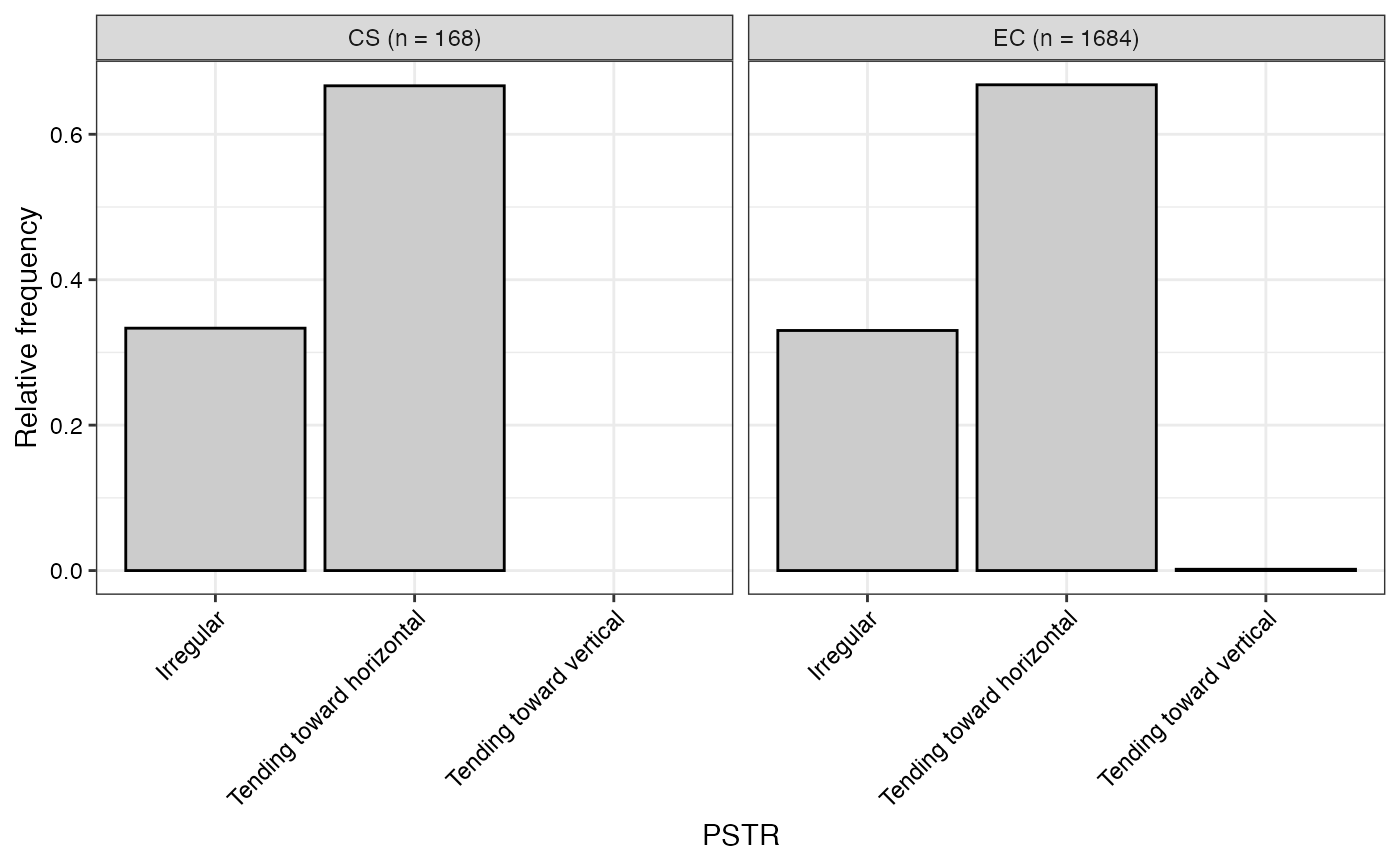
Plot Bar plots to graphically compare the frequency distributions of qualitative traits between entire collection (EC) and core set (CS).
Arguments
- data
The data as a data frame object. The data frame should possess one row per individual and columns with the individual names and multiple trait/character data.
- names
Name of column with the individual names as a character string.
- qualitative
Name of columns with the qualitative traits as a character vector.
- selected
Character vector with the names of individuals selected in core collection and present in the
namescolumn.- na.omit
logical. If
TRUE, missing values (NA) are ignored and not included in the plot as a distinct factor level. Default isTRUE.- show.count
logical. If
TRUE, the accession count excluding missing values will also be displayed. Default isFALSE.
Value
A list with the ggplot objects of relative frequency bar plots
of CS and EC for each trait specified as qualitative.
Examples
data("cassava_CC")
data("cassava_EC")
ec <- cbind(genotypes = rownames(cassava_EC), cassava_EC)
ec$genotypes <- as.character(ec$genotypes)
rownames(ec) <- NULL
core <- rownames(cassava_CC)
quant <- c("NMSR", "TTRN", "TFWSR", "TTRW", "TFWSS", "TTSW", "TTPW", "AVPW",
"ARSR", "SRDM")
qual <- c("CUAL", "LNGS", "PTLC", "DSTA", "LFRT", "LBTEF", "CBTR", "NMLB",
"ANGB", "CUAL9M", "LVC9M", "TNPR9M", "PL9M", "STRP", "STRC",
"PSTR")
ec[, qual] <- lapply(ec[, qual],
function(x) factor(as.factor(x)))
# \donttest{
bar.evaluate.core(data = ec, names = "genotypes",
qualitative = qual, selected = core)
#> $CUAL
 #>
#> $LNGS
#>
#> $LNGS
 #>
#> $PTLC
#>
#> $PTLC
 #>
#> $DSTA
#>
#> $DSTA
 #>
#> $LFRT
#>
#> $LFRT
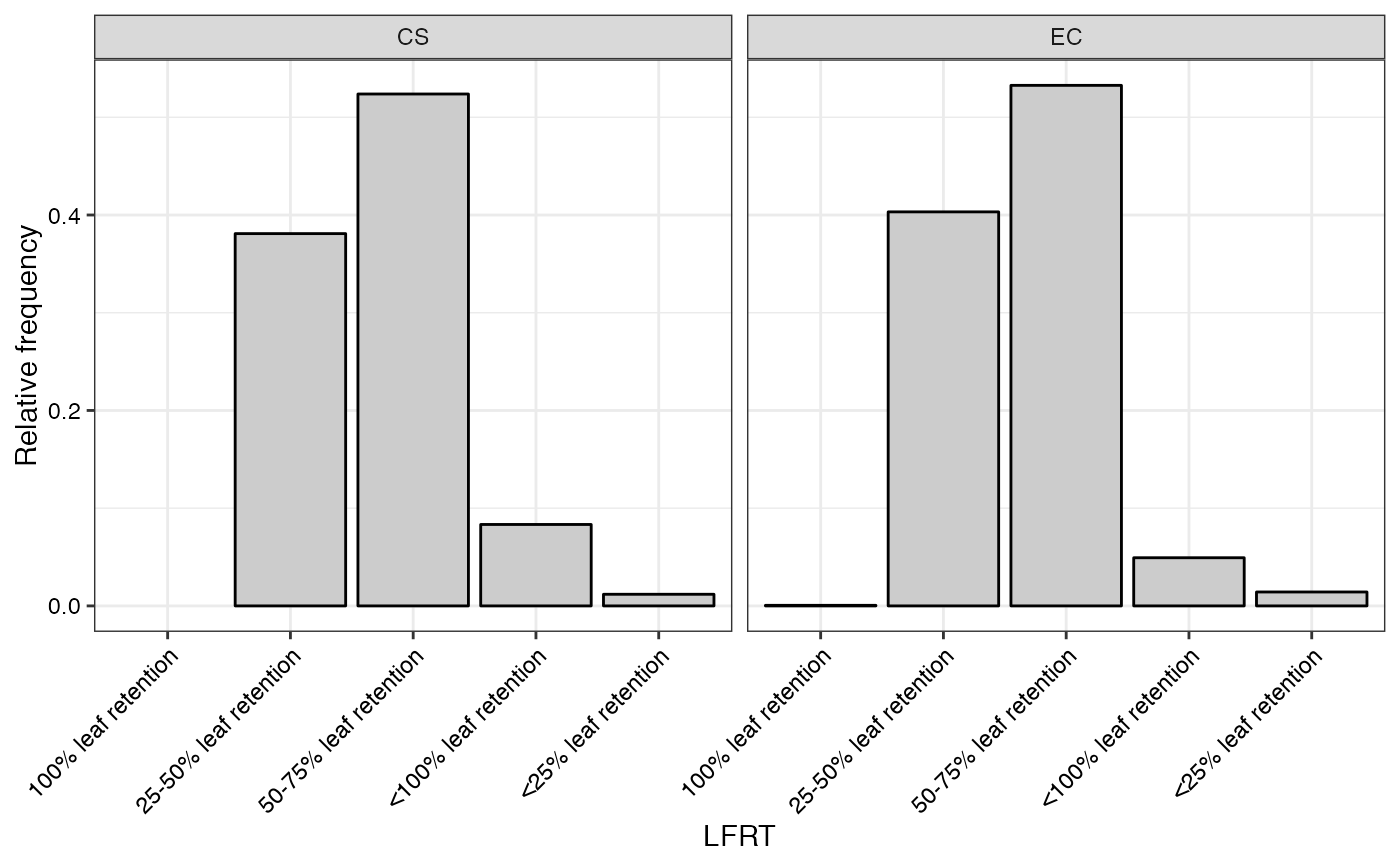 #>
#> $LBTEF
#>
#> $LBTEF
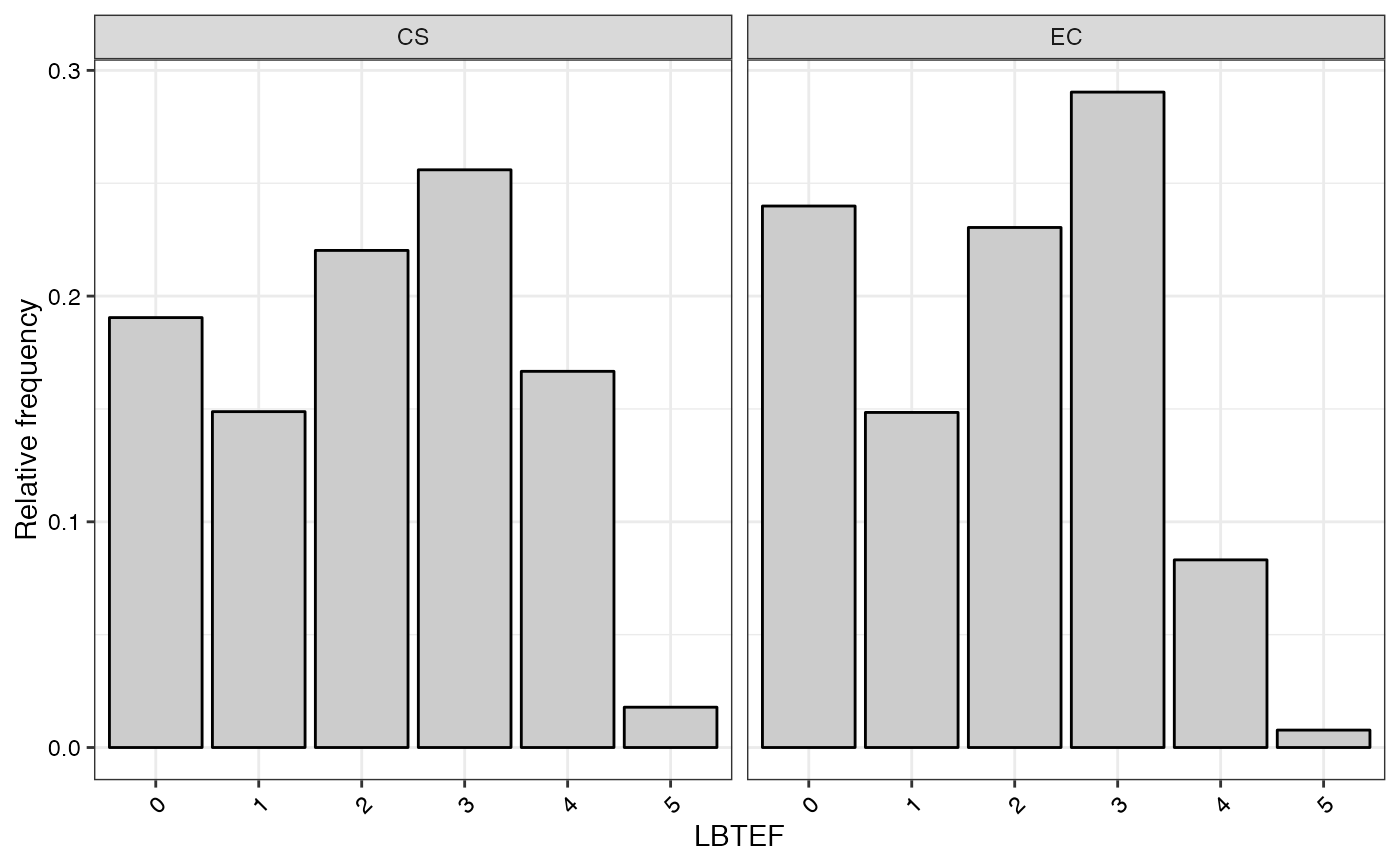 #>
#> $CBTR
#>
#> $CBTR
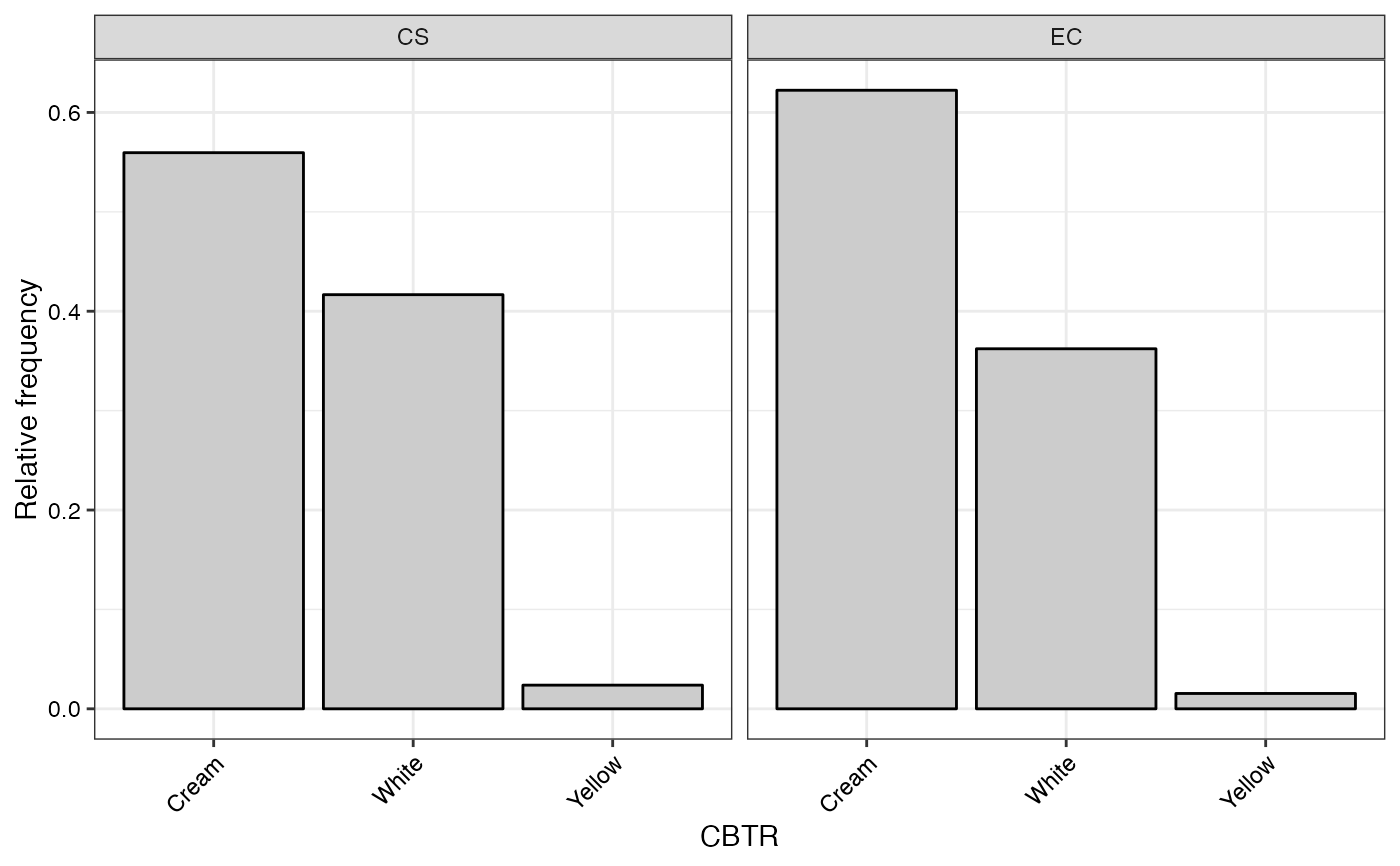 #>
#> $NMLB
#>
#> $NMLB
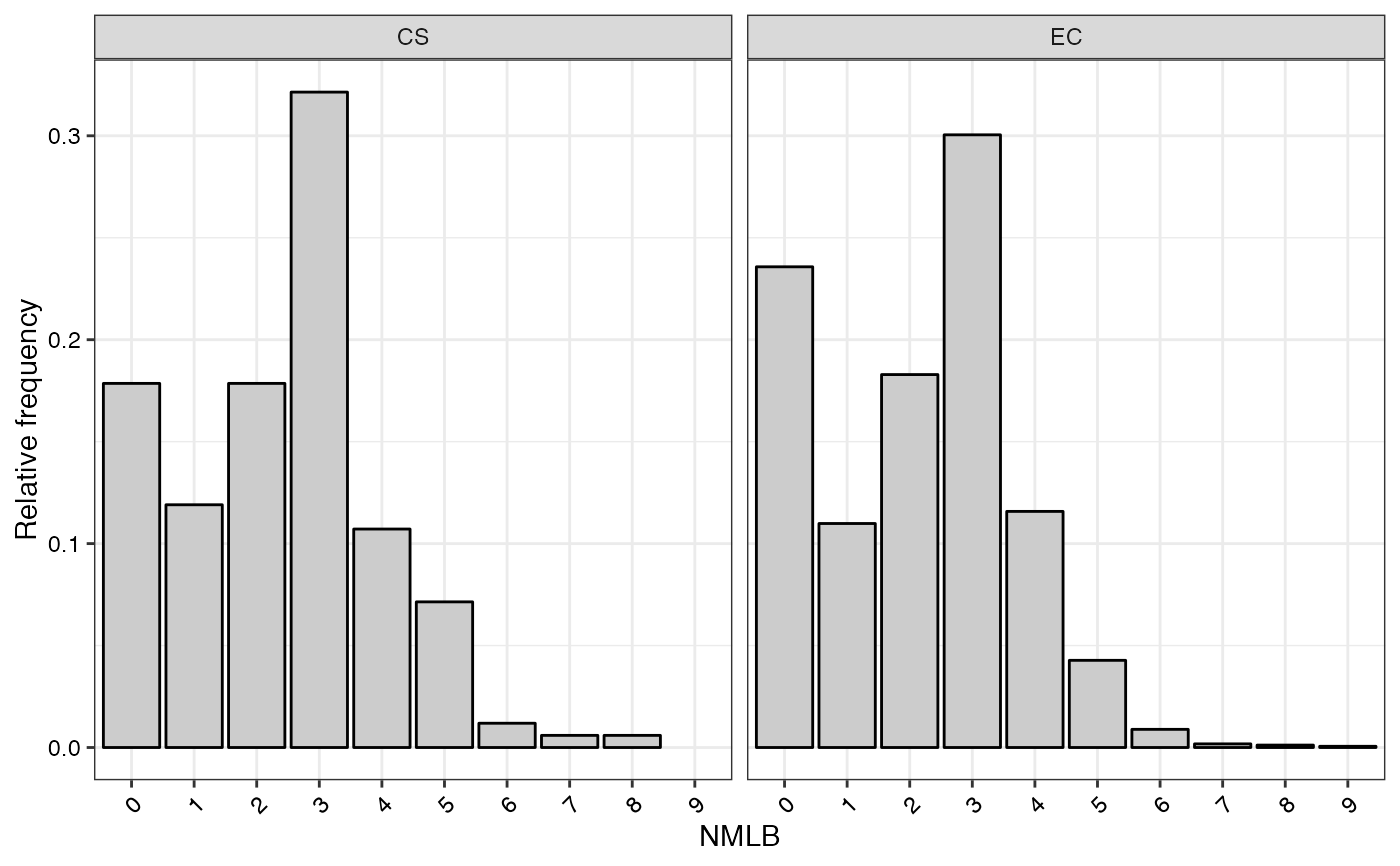 #>
#> $ANGB
#>
#> $ANGB
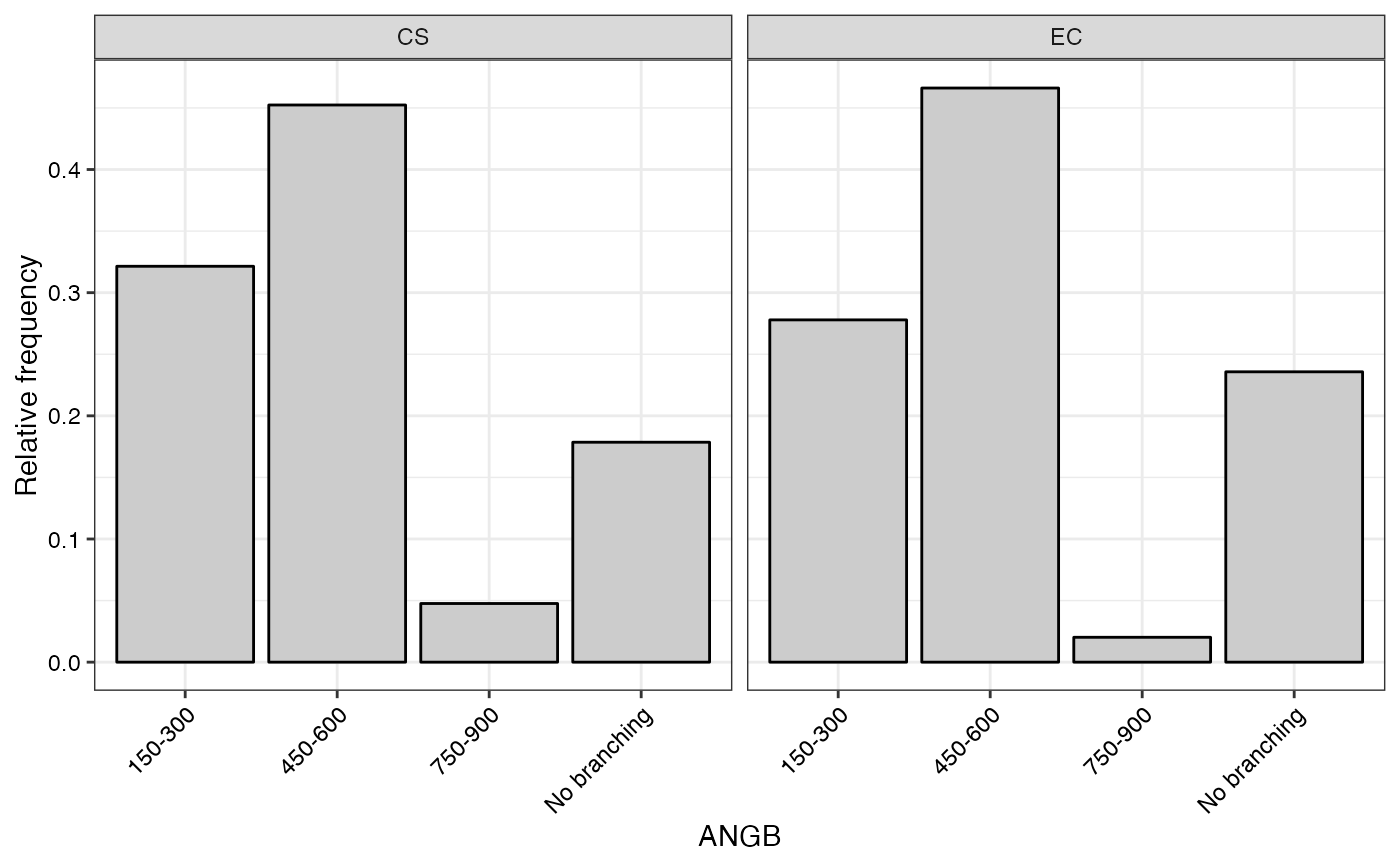 #>
#> $CUAL9M
#>
#> $CUAL9M
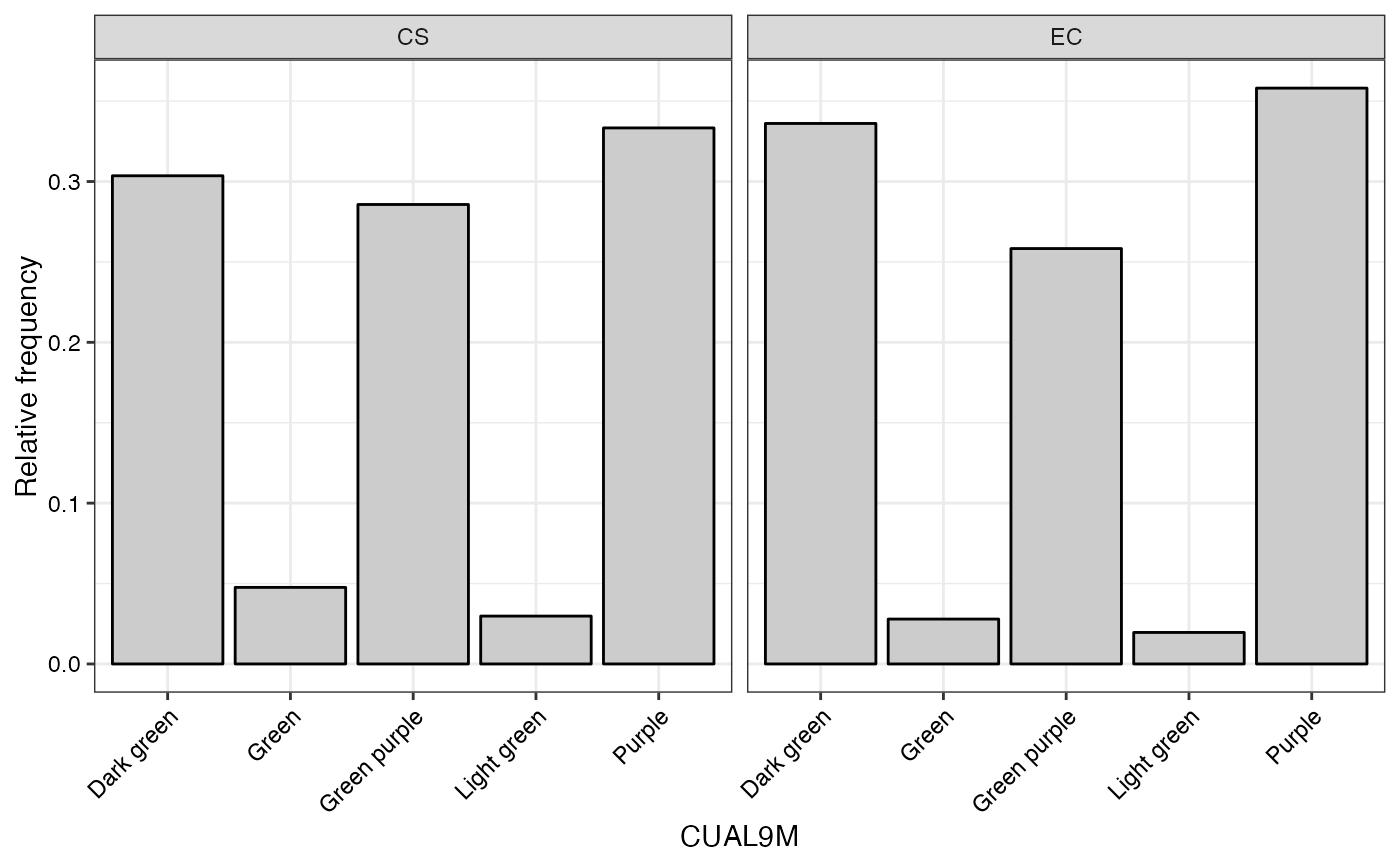 #>
#> $LVC9M
#>
#> $LVC9M
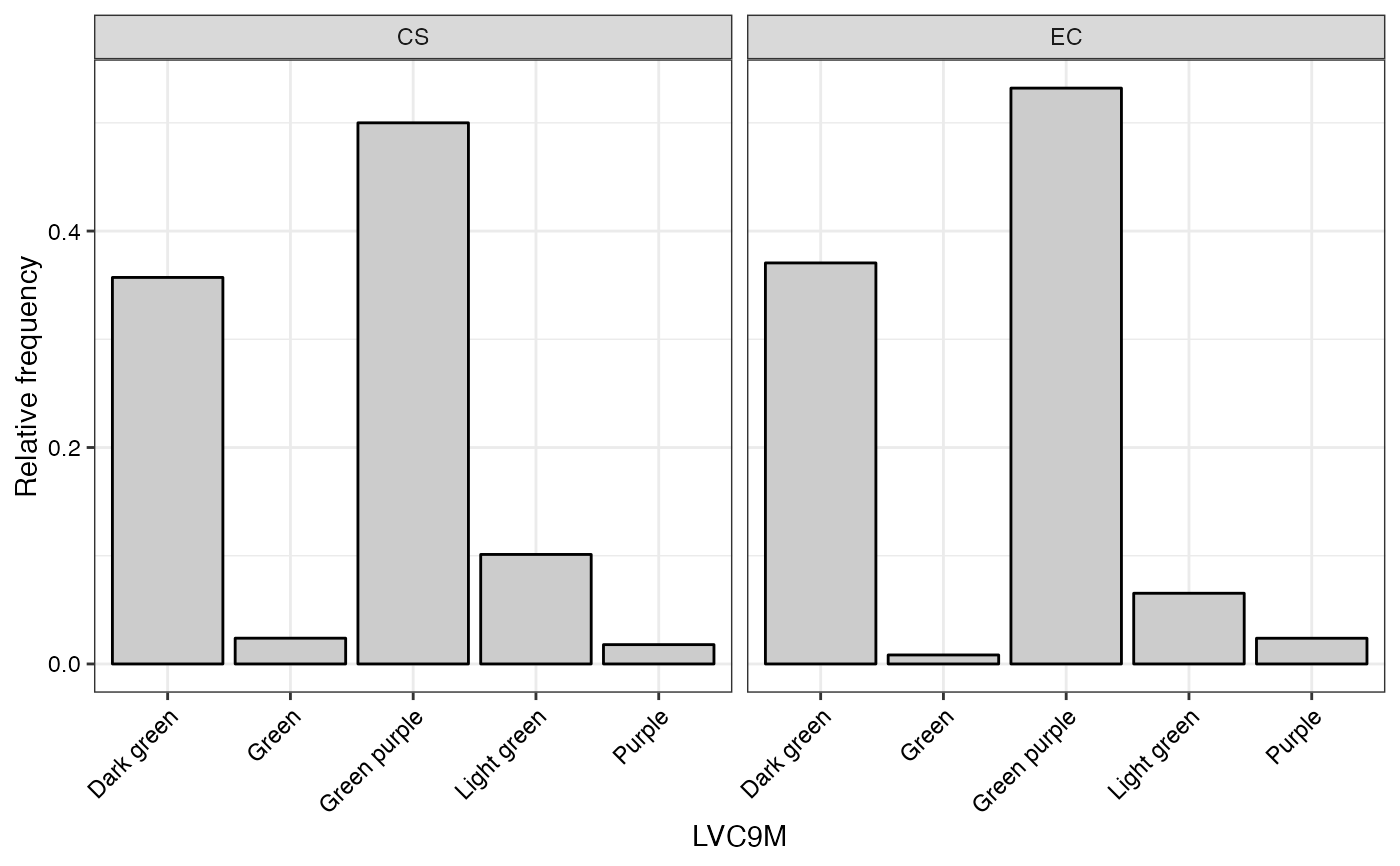 #>
#> $TNPR9M
#>
#> $TNPR9M
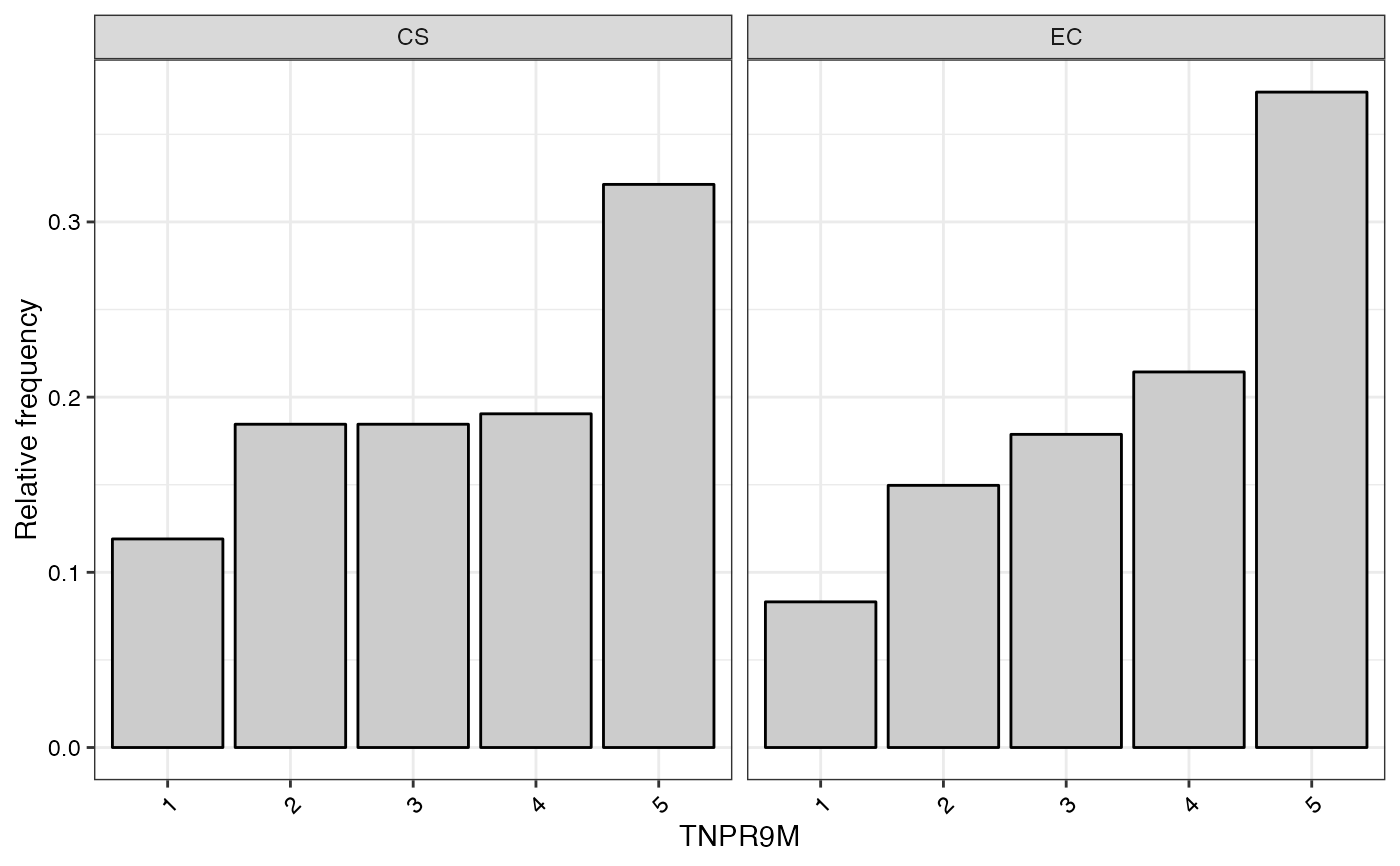 #>
#> $PL9M
#>
#> $PL9M
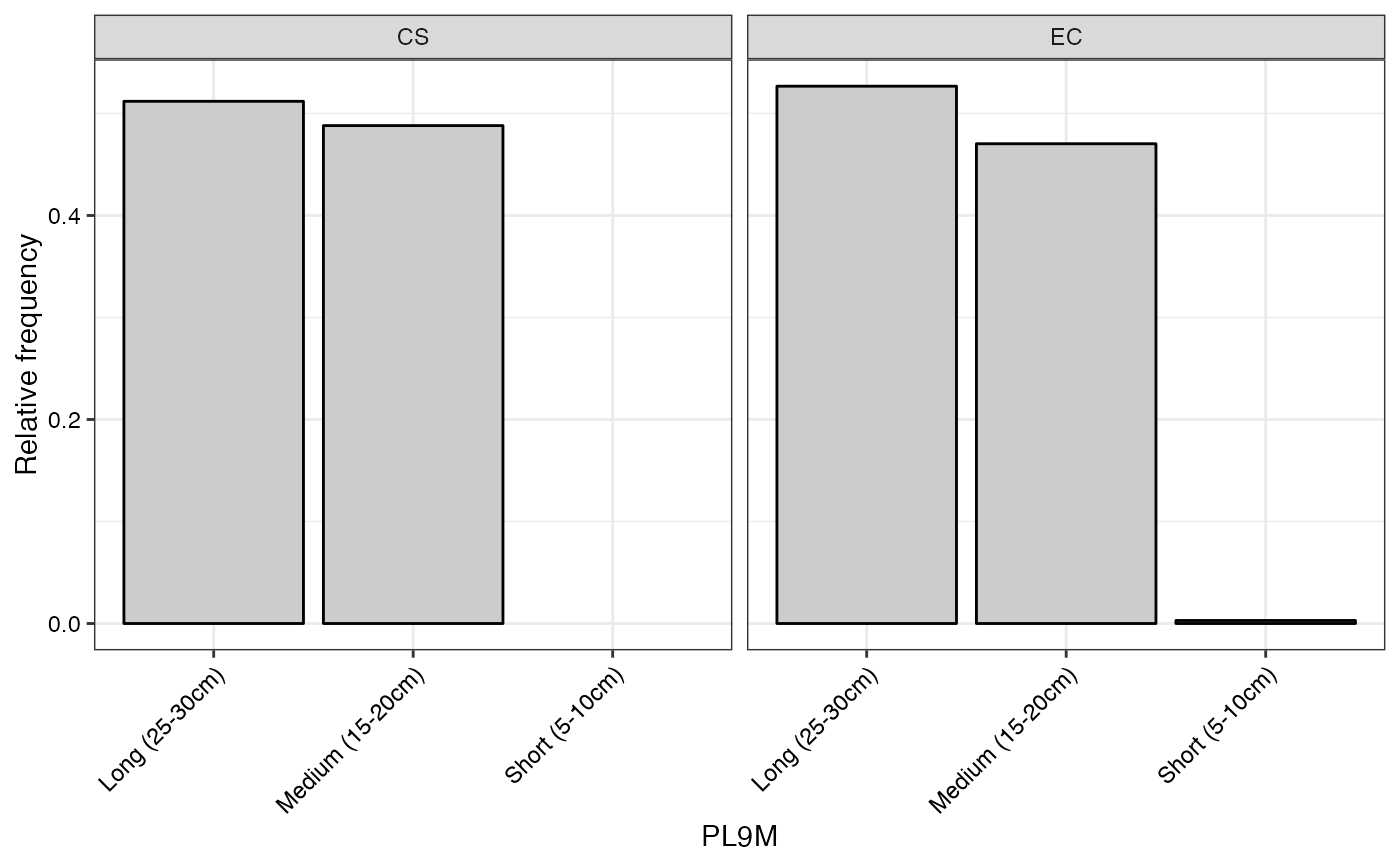 #>
#> $STRP
#>
#> $STRP
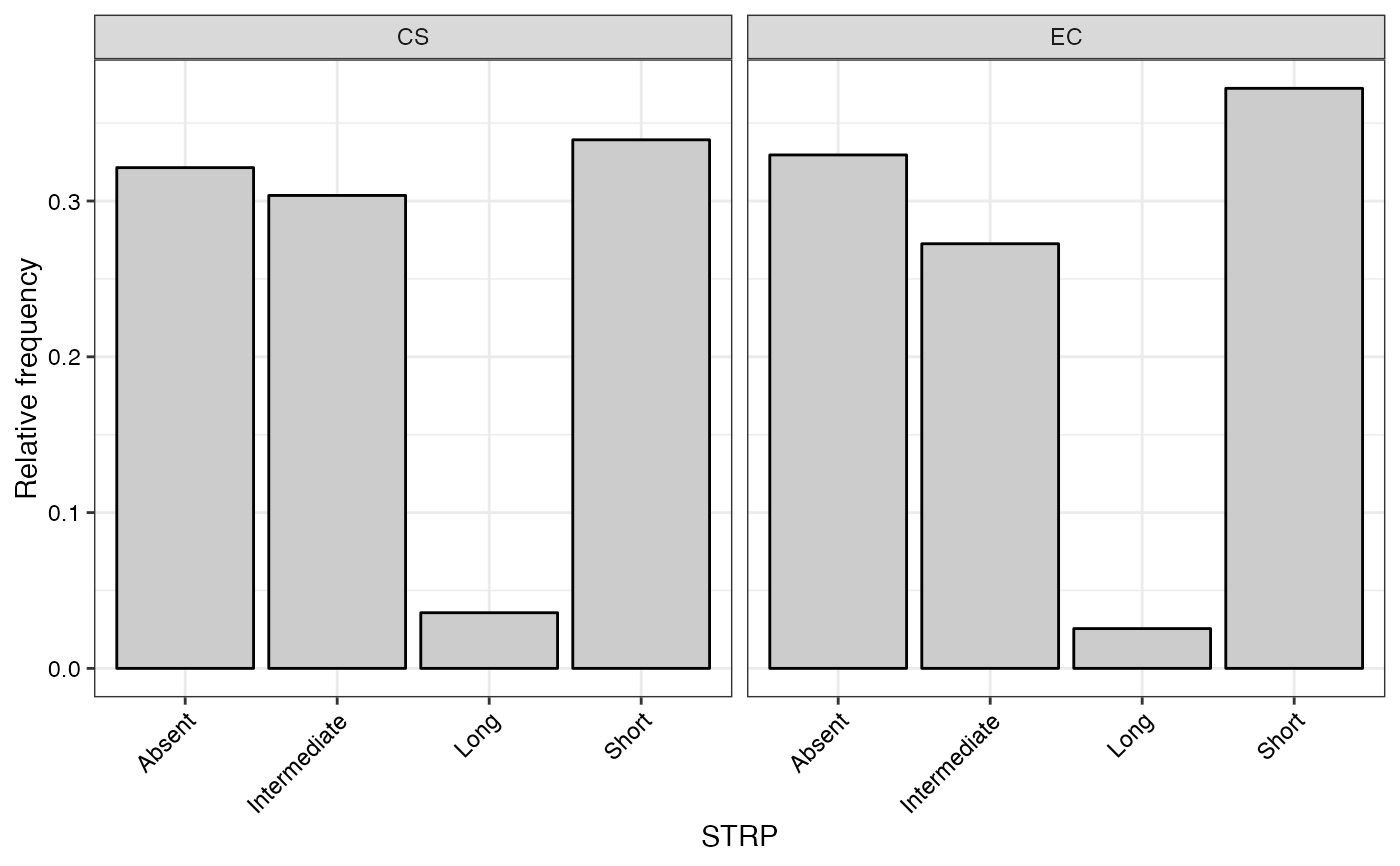 #>
#> $STRC
#>
#> $STRC
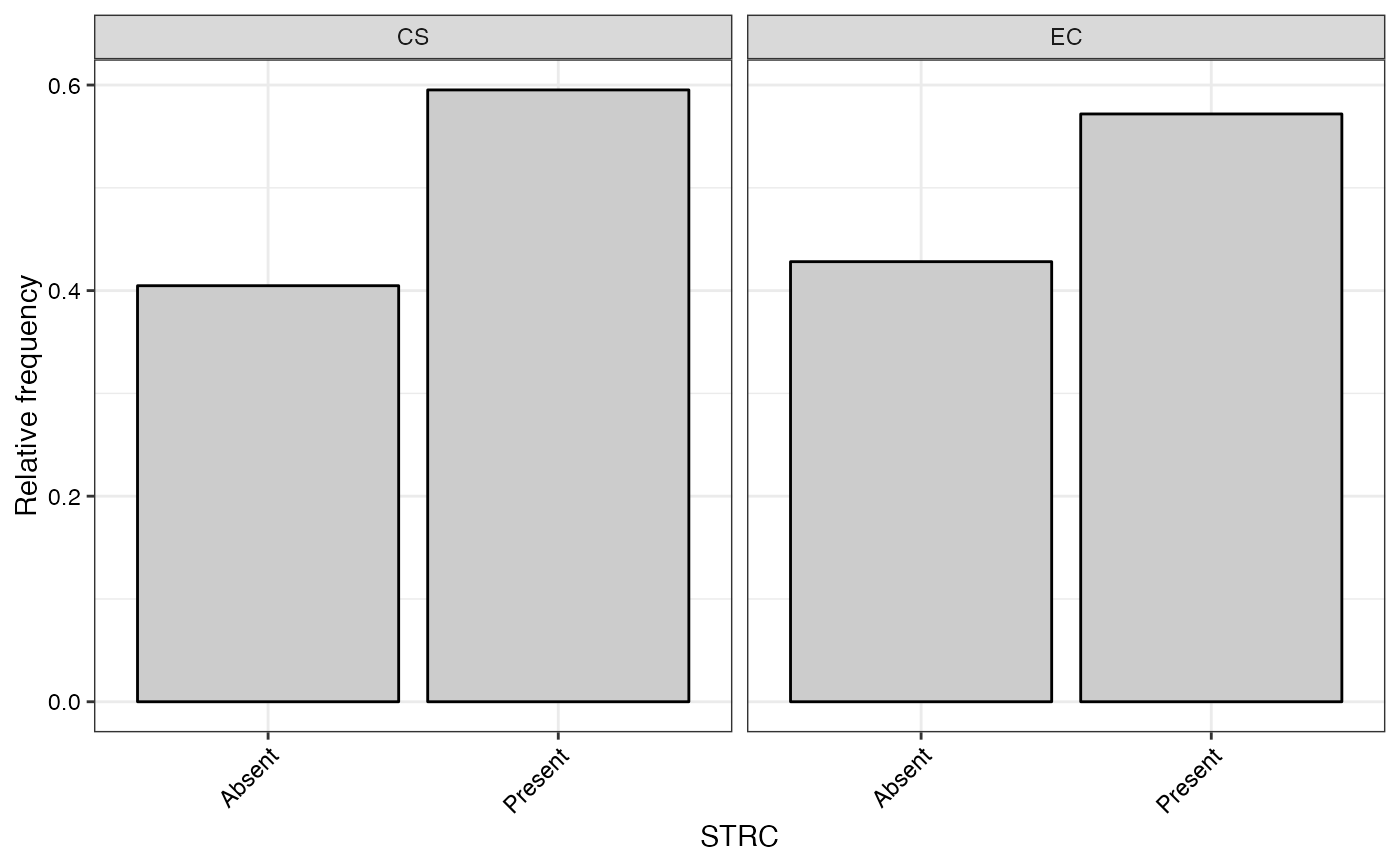 #>
#> $PSTR
#>
#> $PSTR
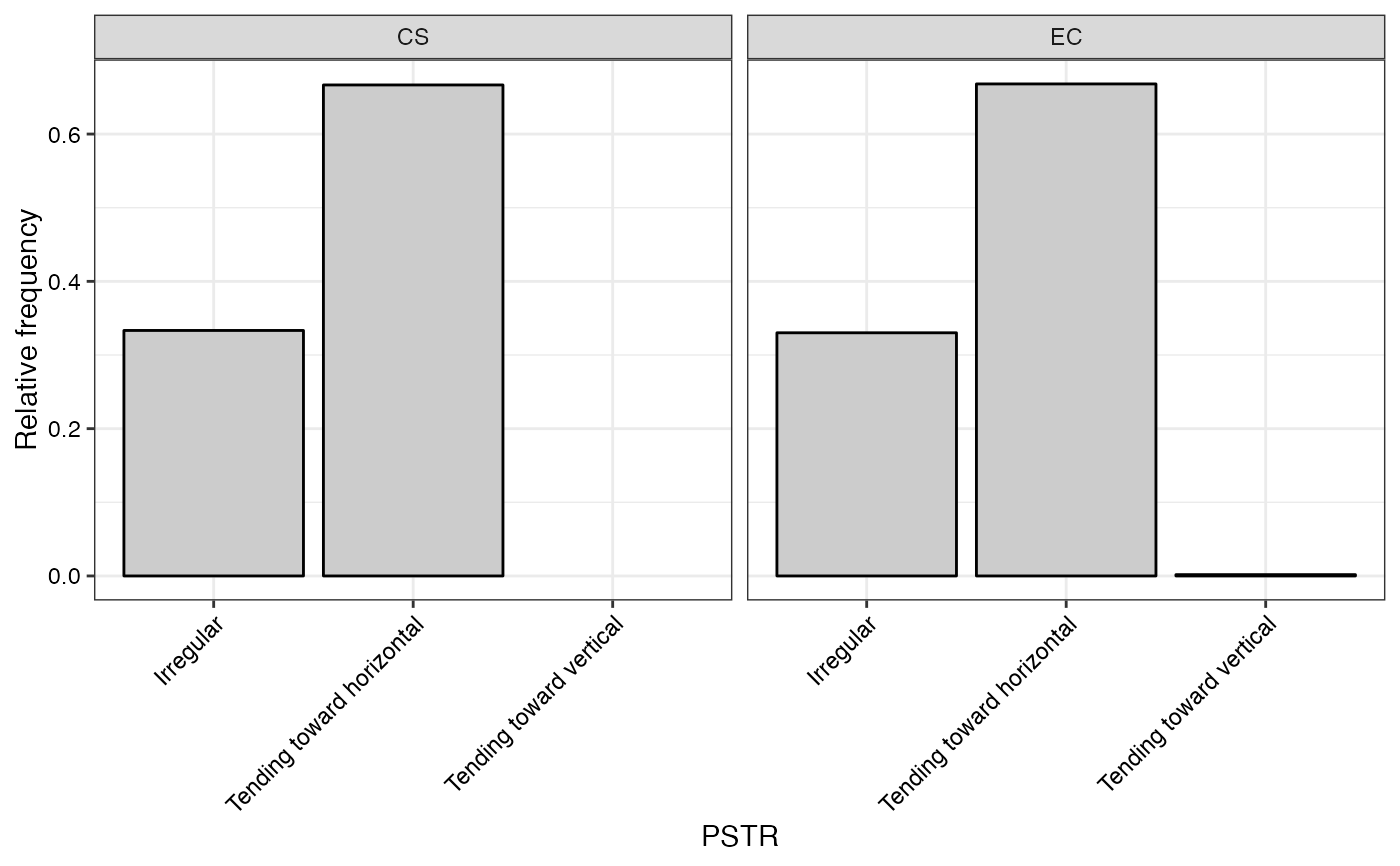 #>
bar.evaluate.core(data = ec, names = "genotypes",
qualitative = qual, selected = core,
show.count = TRUE)
#> $CUAL
#>
bar.evaluate.core(data = ec, names = "genotypes",
qualitative = qual, selected = core,
show.count = TRUE)
#> $CUAL
 #>
#> $LNGS
#>
#> $LNGS
 #>
#> $PTLC
#>
#> $PTLC
 #>
#> $DSTA
#>
#> $DSTA
 #>
#> $LFRT
#>
#> $LFRT
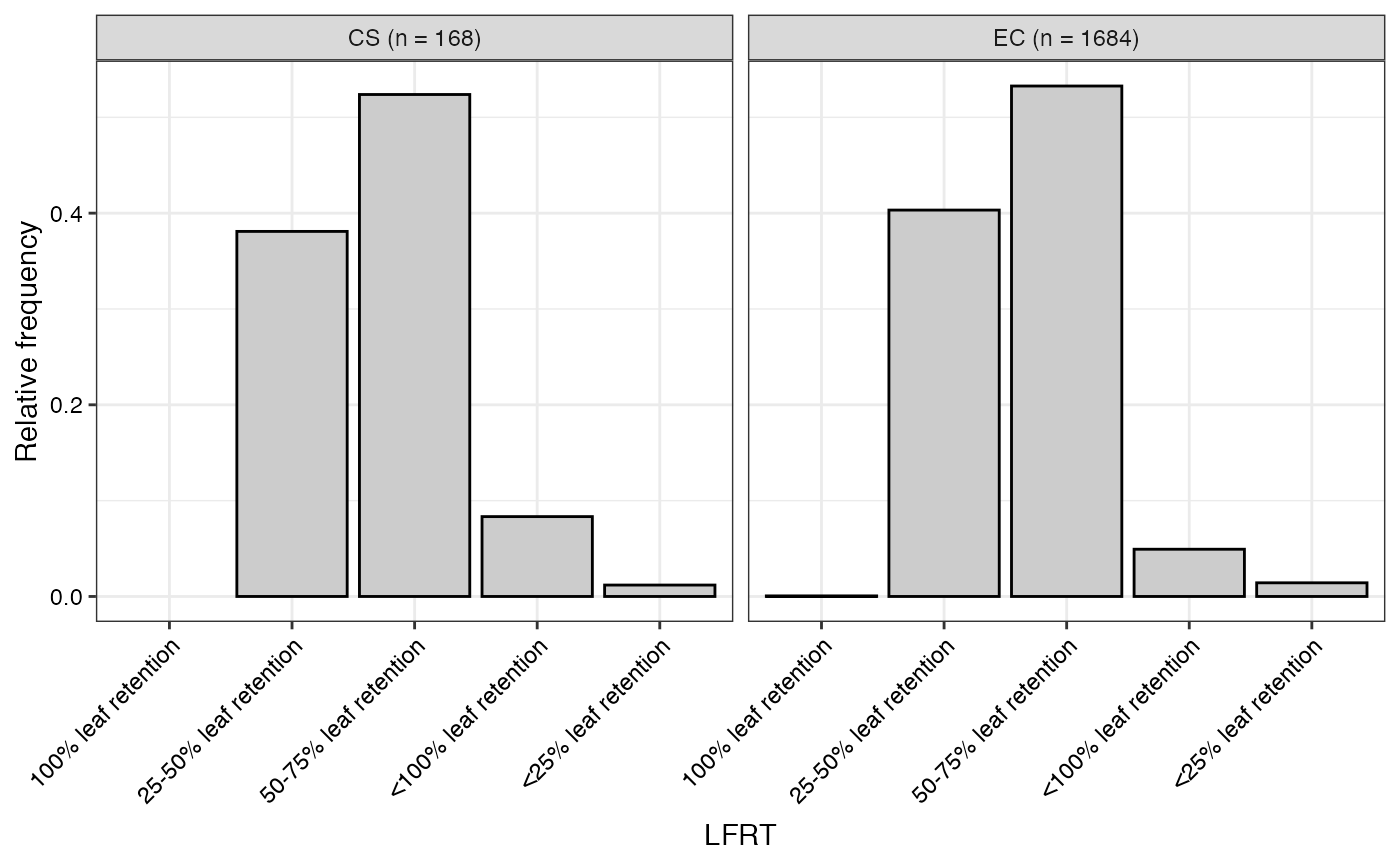 #>
#> $LBTEF
#>
#> $LBTEF
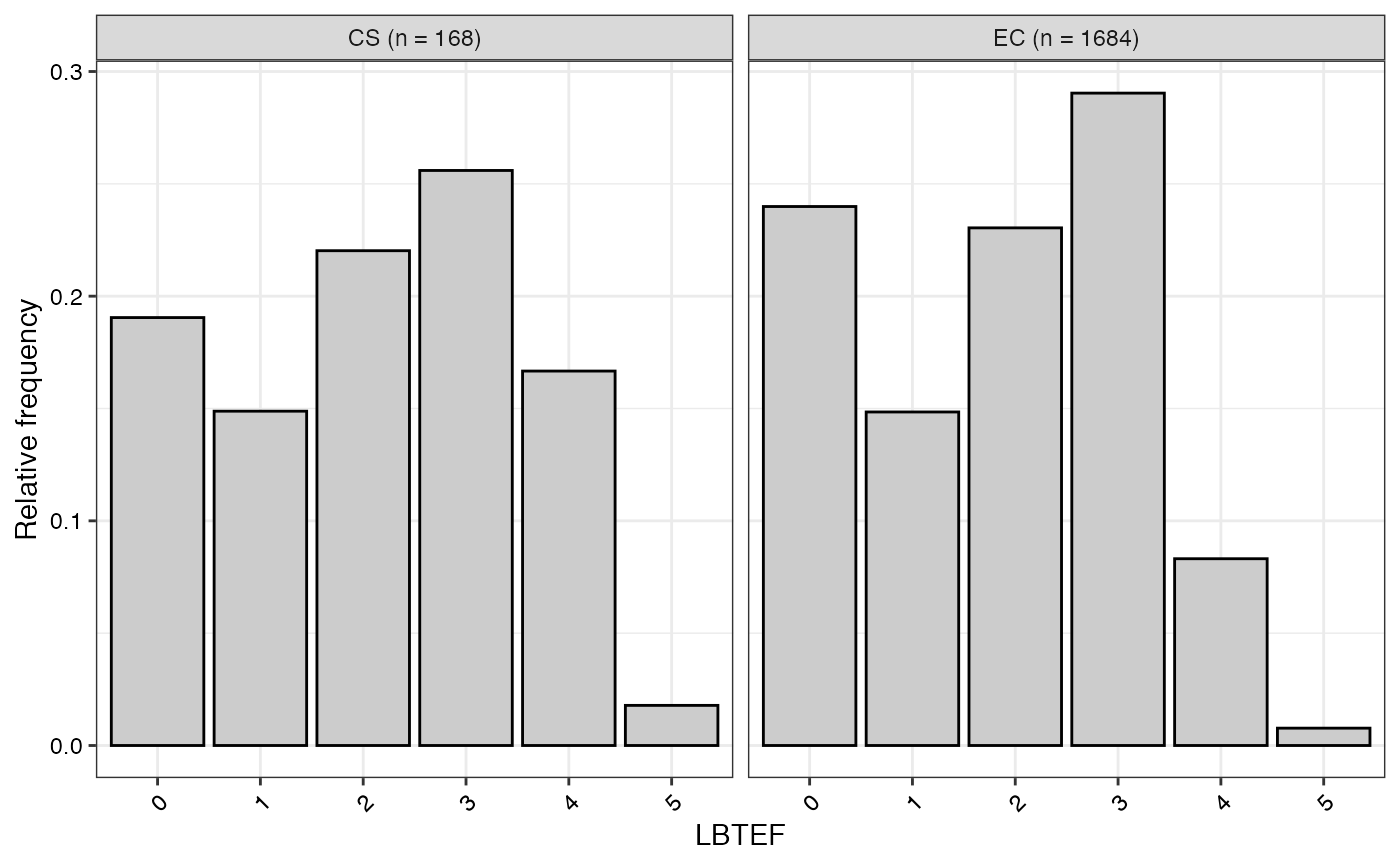 #>
#> $CBTR
#>
#> $CBTR
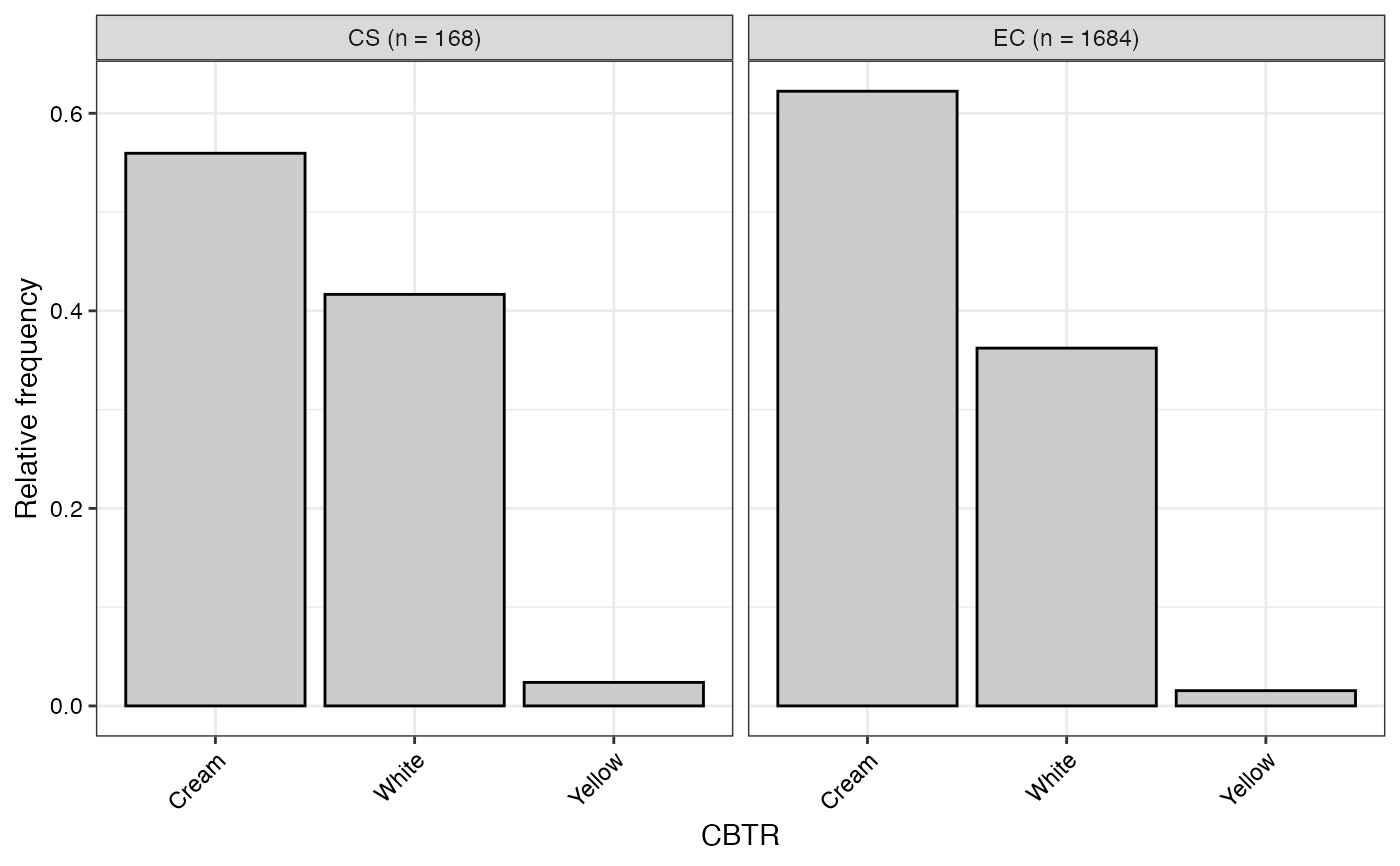 #>
#> $NMLB
#>
#> $NMLB
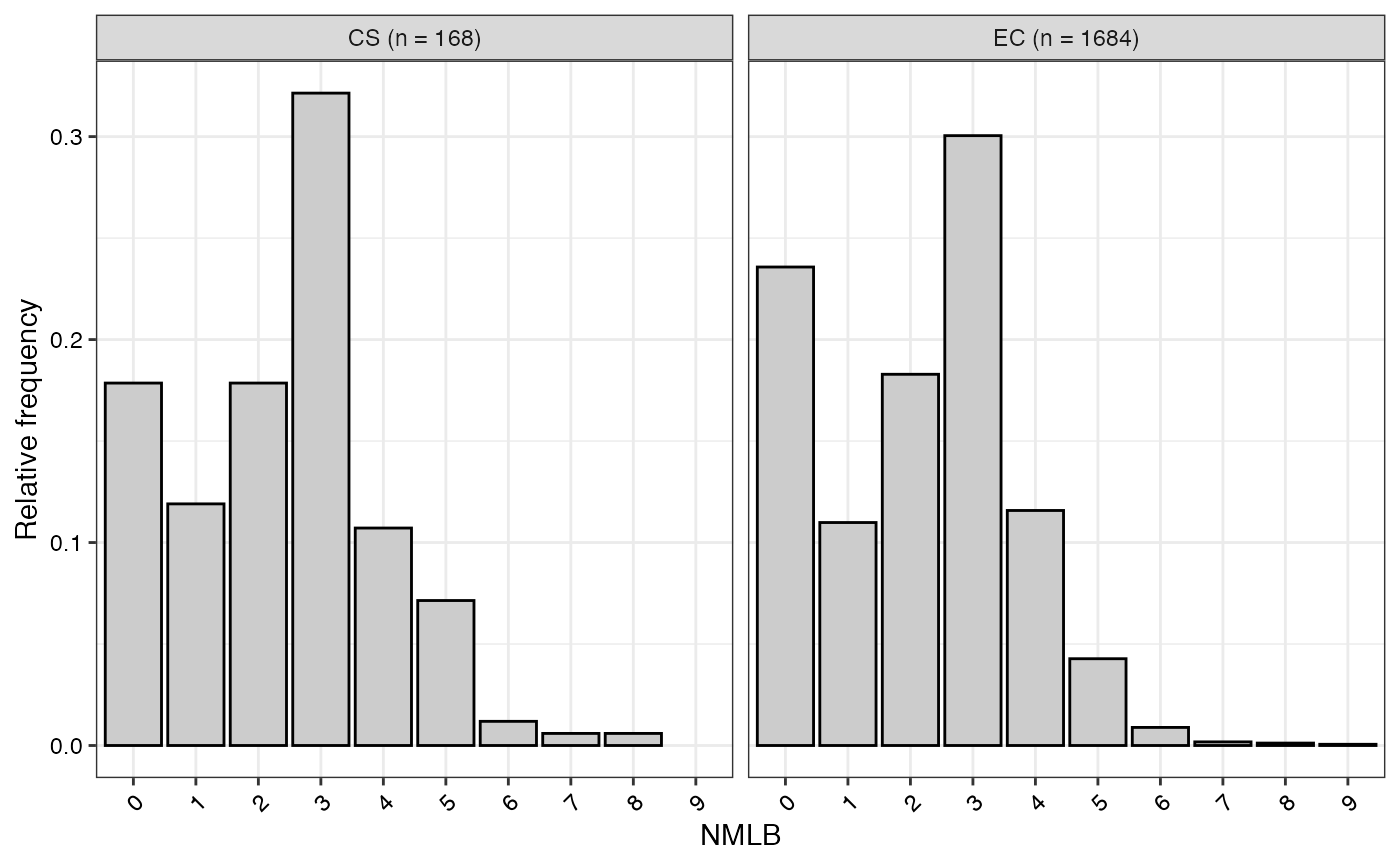 #>
#> $ANGB
#>
#> $ANGB
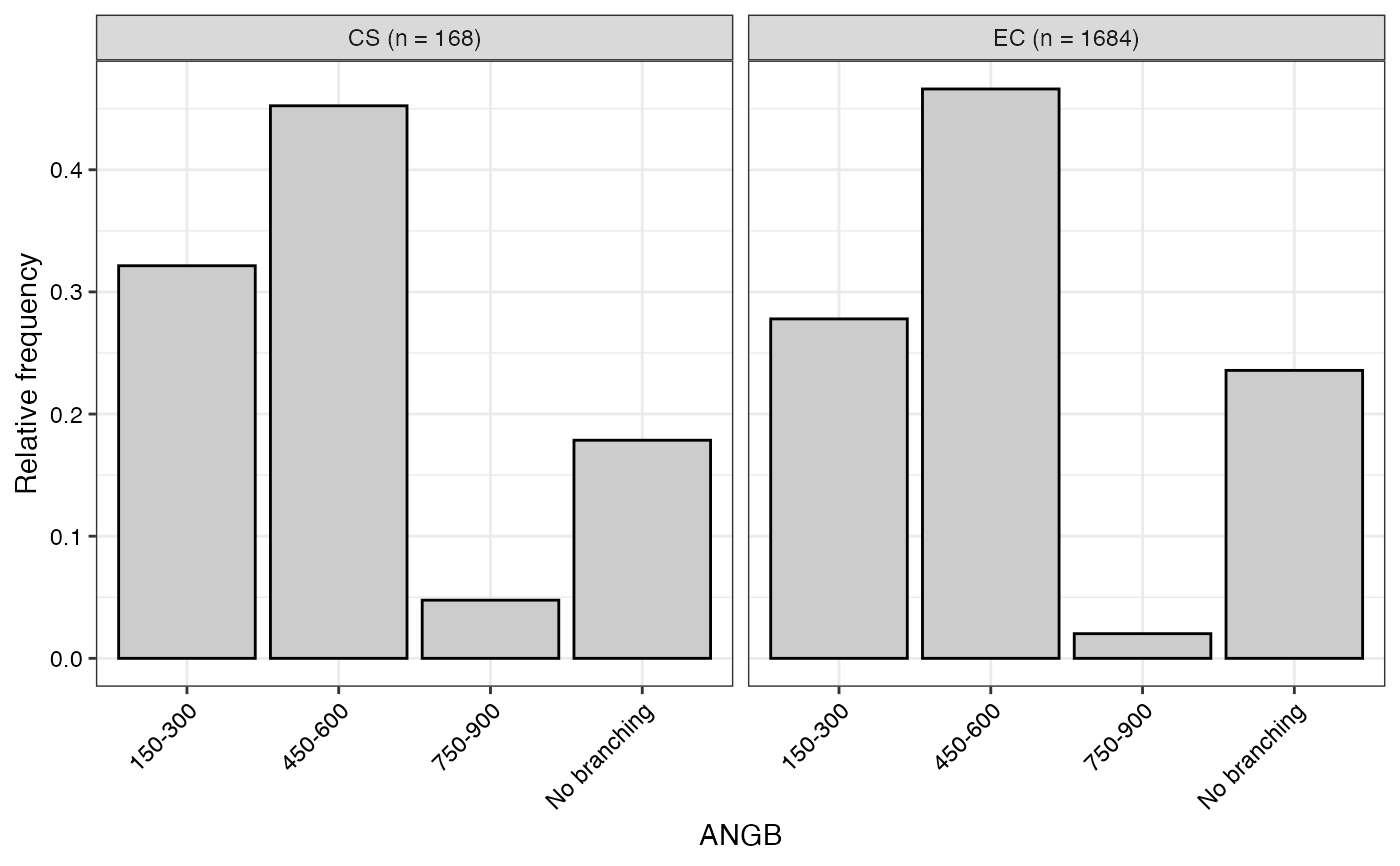 #>
#> $CUAL9M
#>
#> $CUAL9M
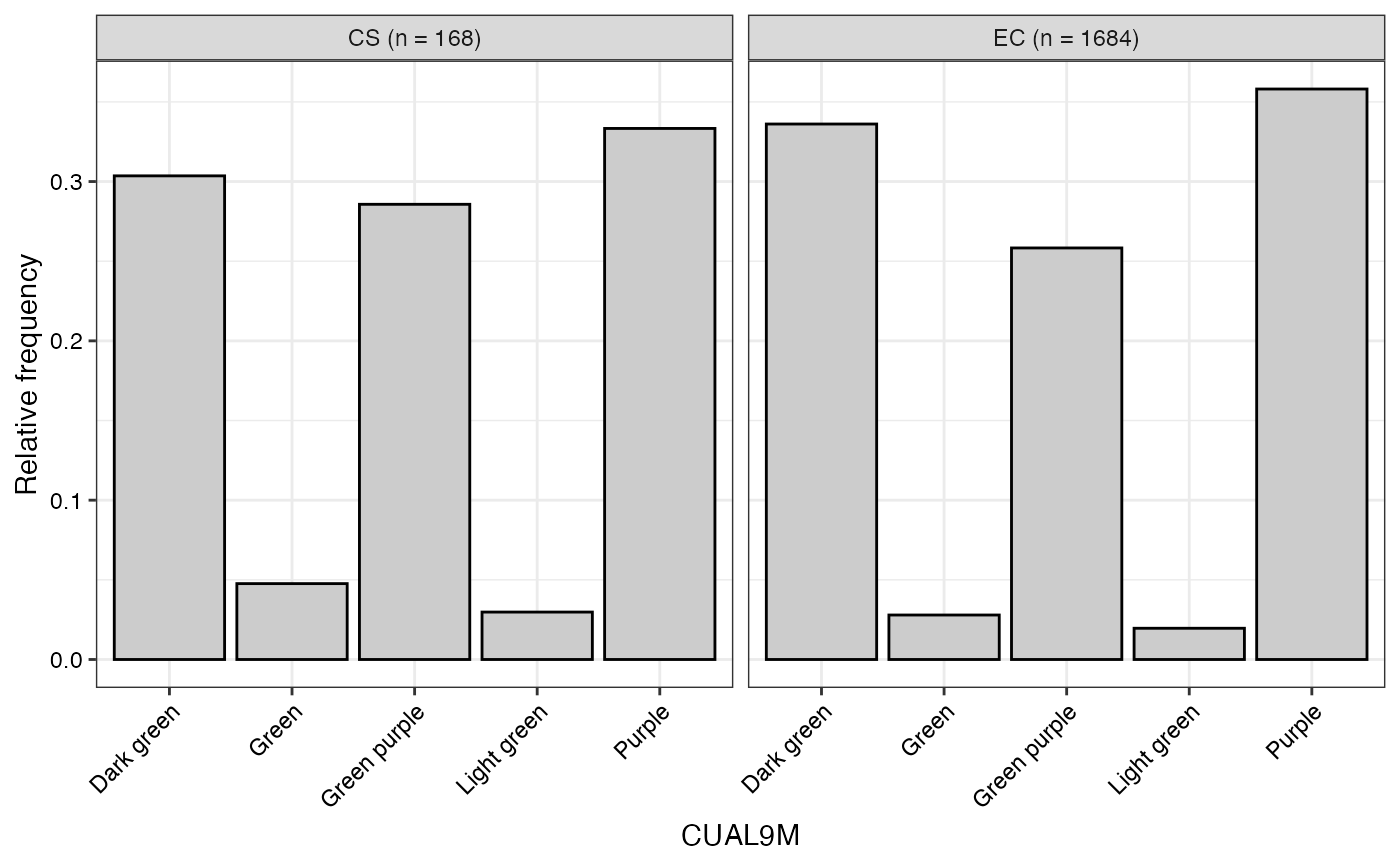 #>
#> $LVC9M
#>
#> $LVC9M
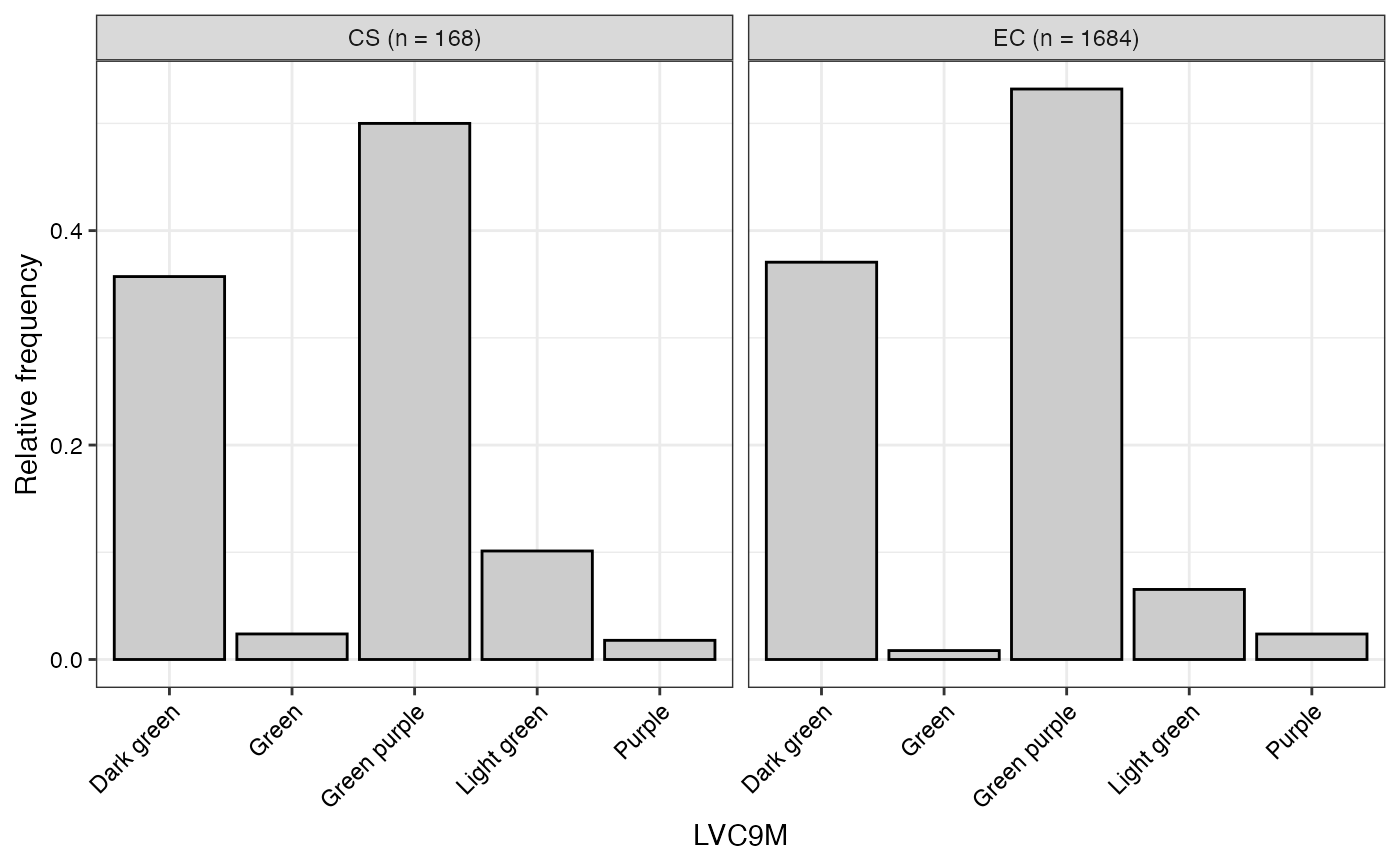 #>
#> $TNPR9M
#>
#> $TNPR9M
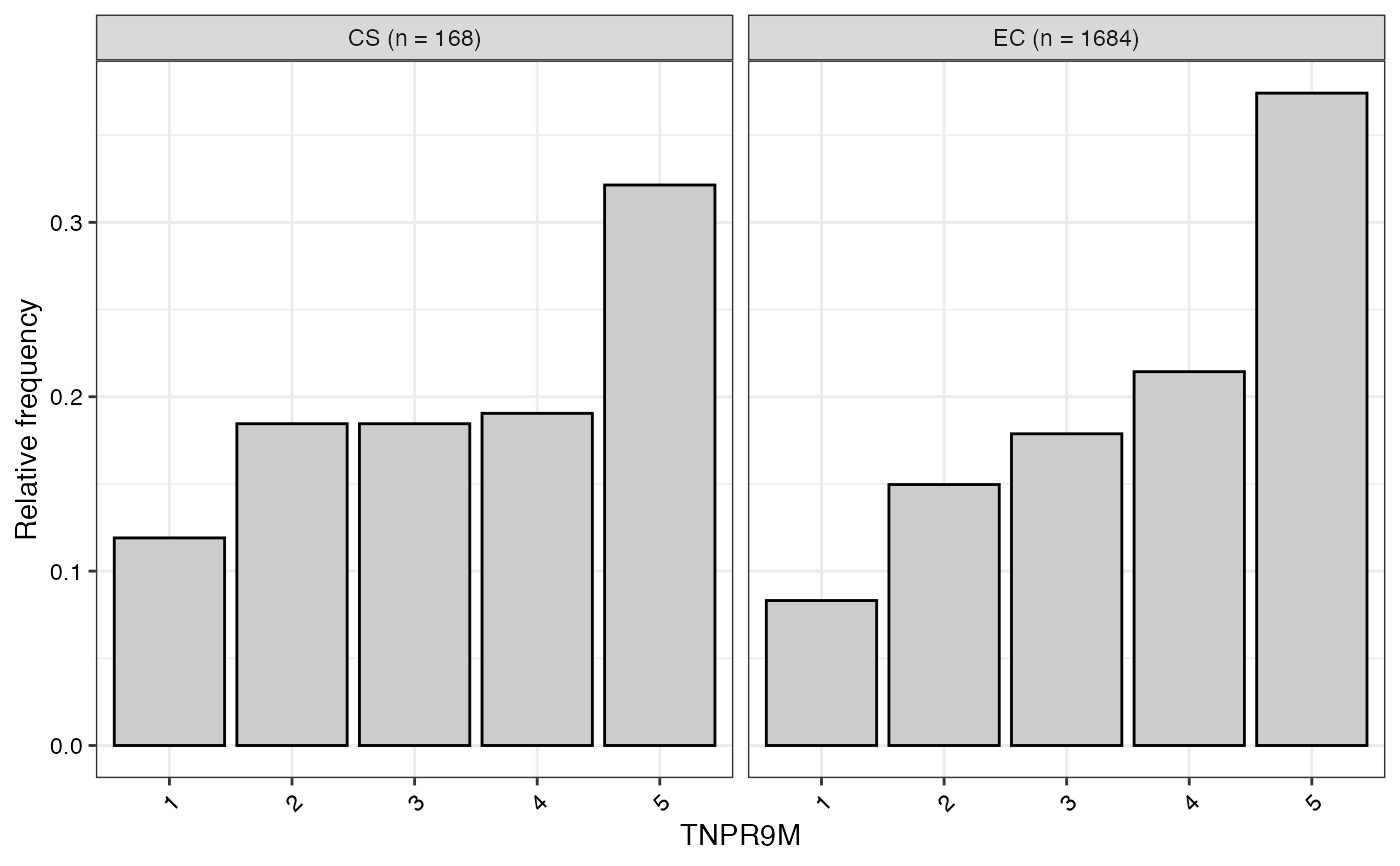 #>
#> $PL9M
#>
#> $PL9M
 #>
#> $STRP
#>
#> $STRP
 #>
#> $STRC
#>
#> $STRC
 #>
#> $PSTR
#>
#> $PSTR
 #>
# }