Plot Group-wise Histograms
Usage
groupwise_histogram(
  data,
  group,
  trait,
  background.hist = TRUE,
  background.hist.alpha = 0.25,
  background.density = TRUE,
  background.density.alpha = 0.1,
  hist = TRUE,
  hist.border = TRUE,
  hist.position = c("identity", "stack"),
  hist.alpha = 0.8,
  bw.adjust = 0.5,
  density = TRUE,
  density.alpha = 0.1,
  normal.curve = TRUE,
  normal.curve.linetype = "solid",
  highlight.mean = TRUE,
  show.counts = TRUE,
  count.text.size = 3,
  subset = c("facet", "list", "none"),
  ncol = NULL,
  nrow = NULL
)
Arguments
- data
The data as a data frame object. The data frame should possess columns specifying the group and trait.
- group
Name of column specifying the group as a character string.
- trait
Name of column specifying the trait as a character string.
- background.hist
logical. If
TRUE, the background data histogram is plotted. Default isTRUE.- background.hist.alpha
Alpha transparency for the background data histogram.
- background.density
logical. If
TRUE, the background data kernel density is plotted. Default isTRUE.- background.density.alpha
Alpha transparency for the background data kernel density.
- hist
logical. If
TRUE, the group-wise histogram is plotted. Default isTRUE.- hist.border
logical. If
TRUE, histogram border is also plotted. Default isTRUE.- hist.position
Histogram position adjustment. Either "identity" or "stack".
- hist.alpha
Alpha transparency for the group-wise histogram.
- bw.adjust
Multiplicative bin width adjustment. Default is 0.5 which means use half of the default bandwidth.
- density
logical. If
TRUE, the group-wise kernel density is plotted. Default isTRUE.- density.alpha
Alpha transparency for the group-wise kernel density
- normal.curve
logical. If
TRUE, a normal curve is plotted. Default isTRUE.- normal.curve.linetype
Linetype for the normal curve. See
aes_linetype_size_shape.- highlight.mean
logical. If
TRUE, the mean value is highlighted as a vertical line. Default isTRUE.- show.counts
logical. If
TRUE, group wise counts are plotted as a text annotation. Default isTRUE.- count.text.size
The size of the count text annotation.
- subset
The method for subsetting the plots according to the argument
"group". Either"facet"for getting an plot using faceting inggplot2or"list"for getting a list of plots.- ncol
Number of columns when
subset = "facet".- nrow
Number of rows when
subset = "facet".
Examples
library(agridat)
library(ggplot2)
library(patchwork)
soydata <- australia.soybean
# soydata[soydata$loc == "Nambour", ]$lodging <- NA
clrs <- c("#B2182B", "#2166AC", "#009E53", "#E69F00")
clrs_dark <- colorspace::darken(clrs, amount = 0.2)
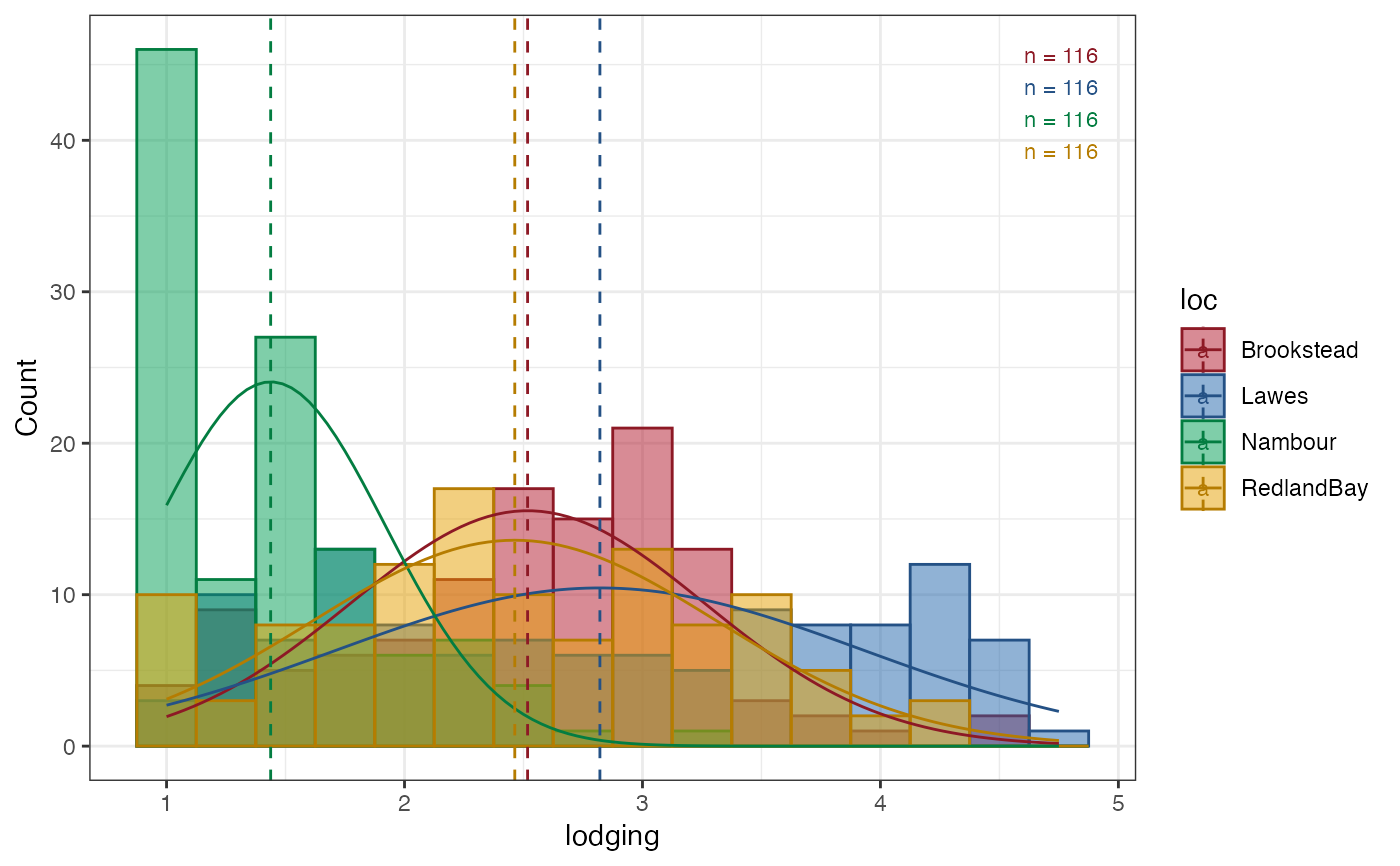
# Group-wise histogram ----
outg_hist <-
groupwise_histogram(data = soydata, group = "loc", trait = "lodging",
background.hist = FALSE,
background.density = FALSE,
hist.alpha = 0.5,
density = FALSE,
subset = "none")
outg_hist
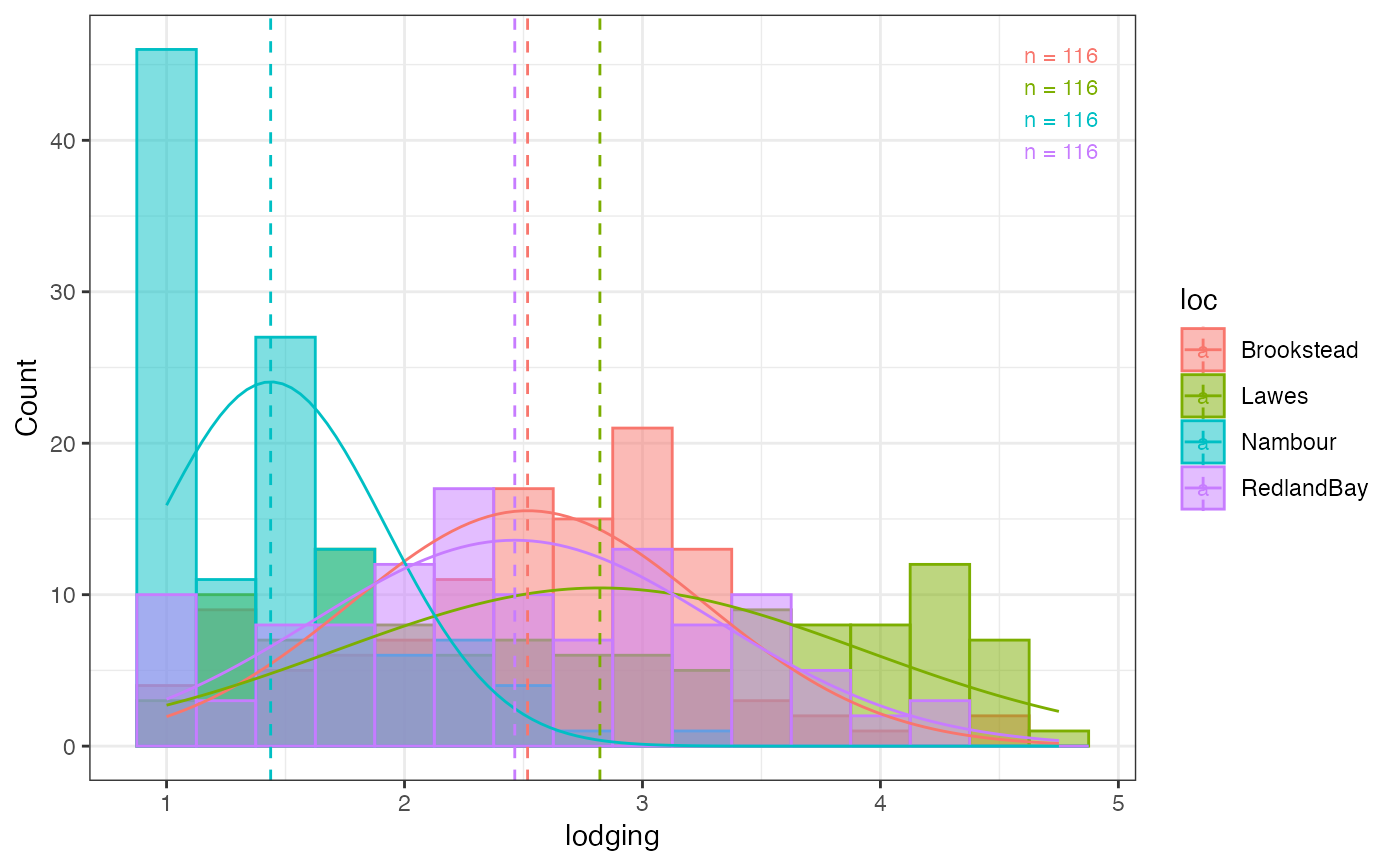 outg_hist +
scale_fill_manual(values = clrs) +
scale_colour_manual(values = clrs_dark)
#> Scale for fill is already present.
#> Adding another scale for fill, which will replace the existing scale.
#> Scale for colour is already present.
#> Adding another scale for colour, which will replace the existing scale.
outg_hist +
scale_fill_manual(values = clrs) +
scale_colour_manual(values = clrs_dark)
#> Scale for fill is already present.
#> Adding another scale for fill, which will replace the existing scale.
#> Scale for colour is already present.
#> Adding another scale for colour, which will replace the existing scale.
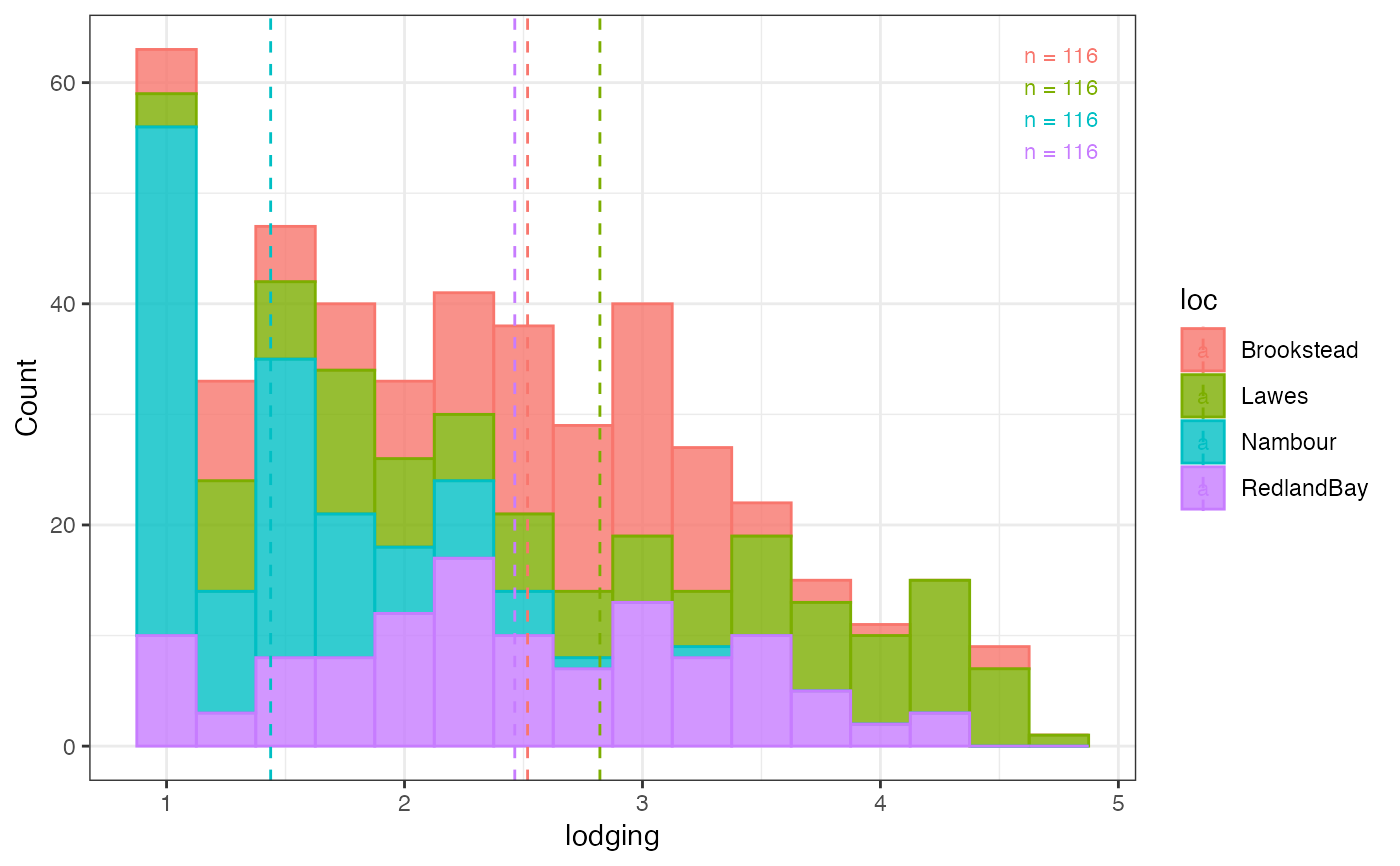
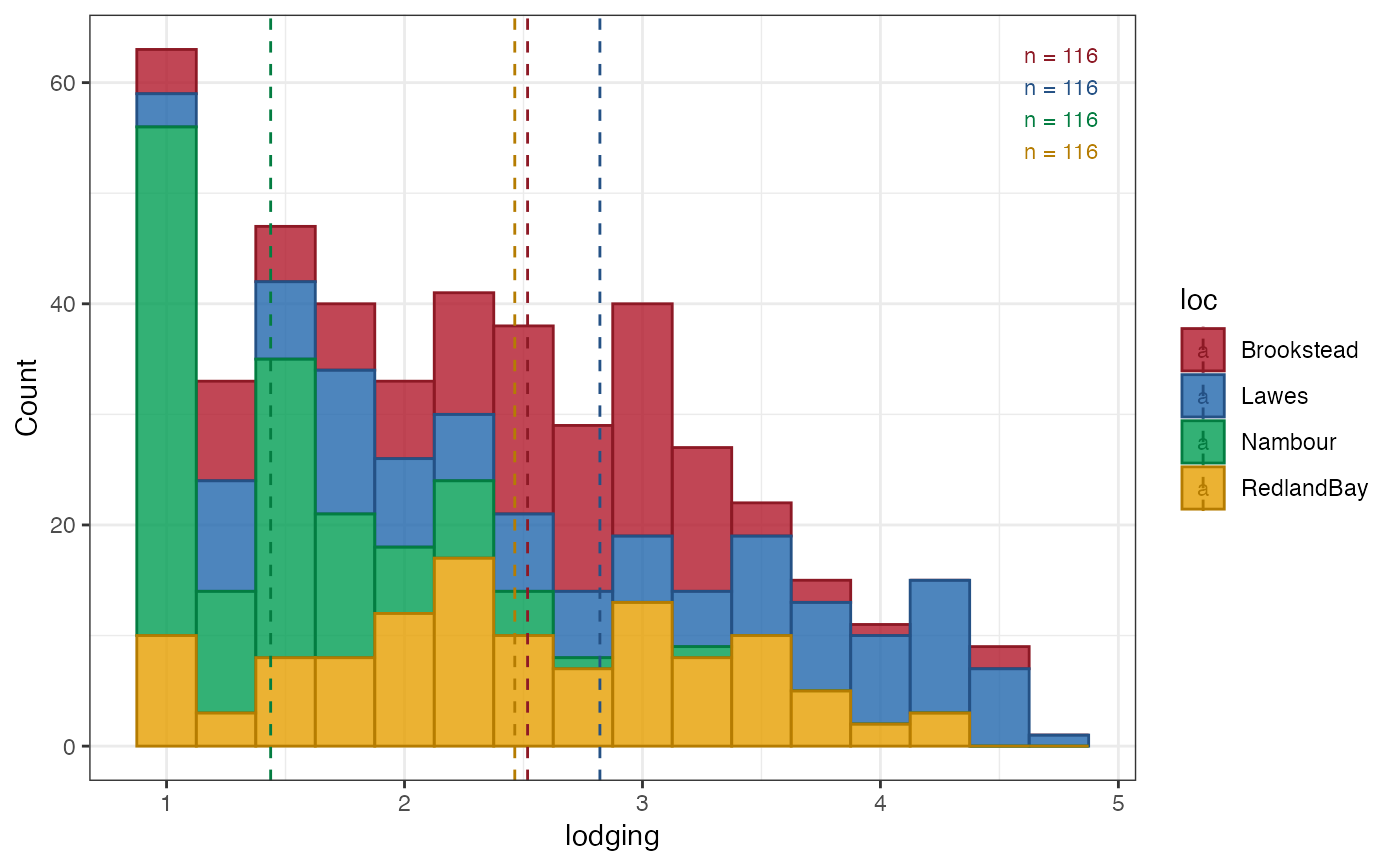
 # Group-wise histogram - stacked ----
outg_hist_stack <-
groupwise_histogram(data = soydata, group = "loc", trait = "lodging",
background.hist = FALSE,
background.density = FALSE,
hist.position = "stack",
density = FALSE,
normal.curve = FALSE,
subset = "none")
outg_hist_stack
# Group-wise histogram - stacked ----
outg_hist_stack <-
groupwise_histogram(data = soydata, group = "loc", trait = "lodging",
background.hist = FALSE,
background.density = FALSE,
hist.position = "stack",
density = FALSE,
normal.curve = FALSE,
subset = "none")
outg_hist_stack
 outg_hist_stack +
scale_fill_manual(values = clrs) +
scale_colour_manual(values = clrs_dark)
#> Scale for fill is already present.
#> Adding another scale for fill, which will replace the existing scale.
#> Scale for colour is already present.
#> Adding another scale for colour, which will replace the existing scale.
outg_hist_stack +
scale_fill_manual(values = clrs) +
scale_colour_manual(values = clrs_dark)
#> Scale for fill is already present.
#> Adding another scale for fill, which will replace the existing scale.
#> Scale for colour is already present.
#> Adding another scale for colour, which will replace the existing scale.
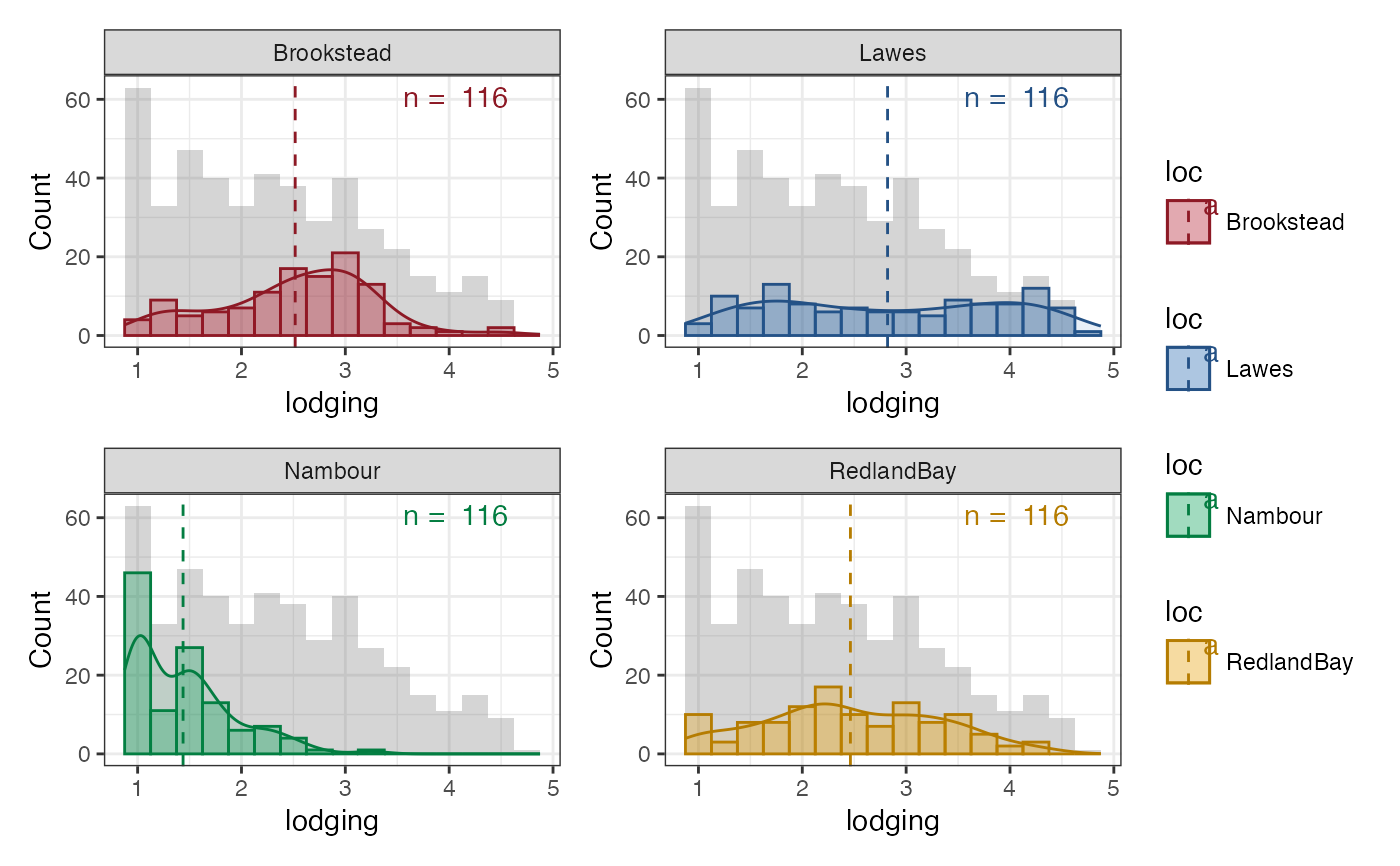
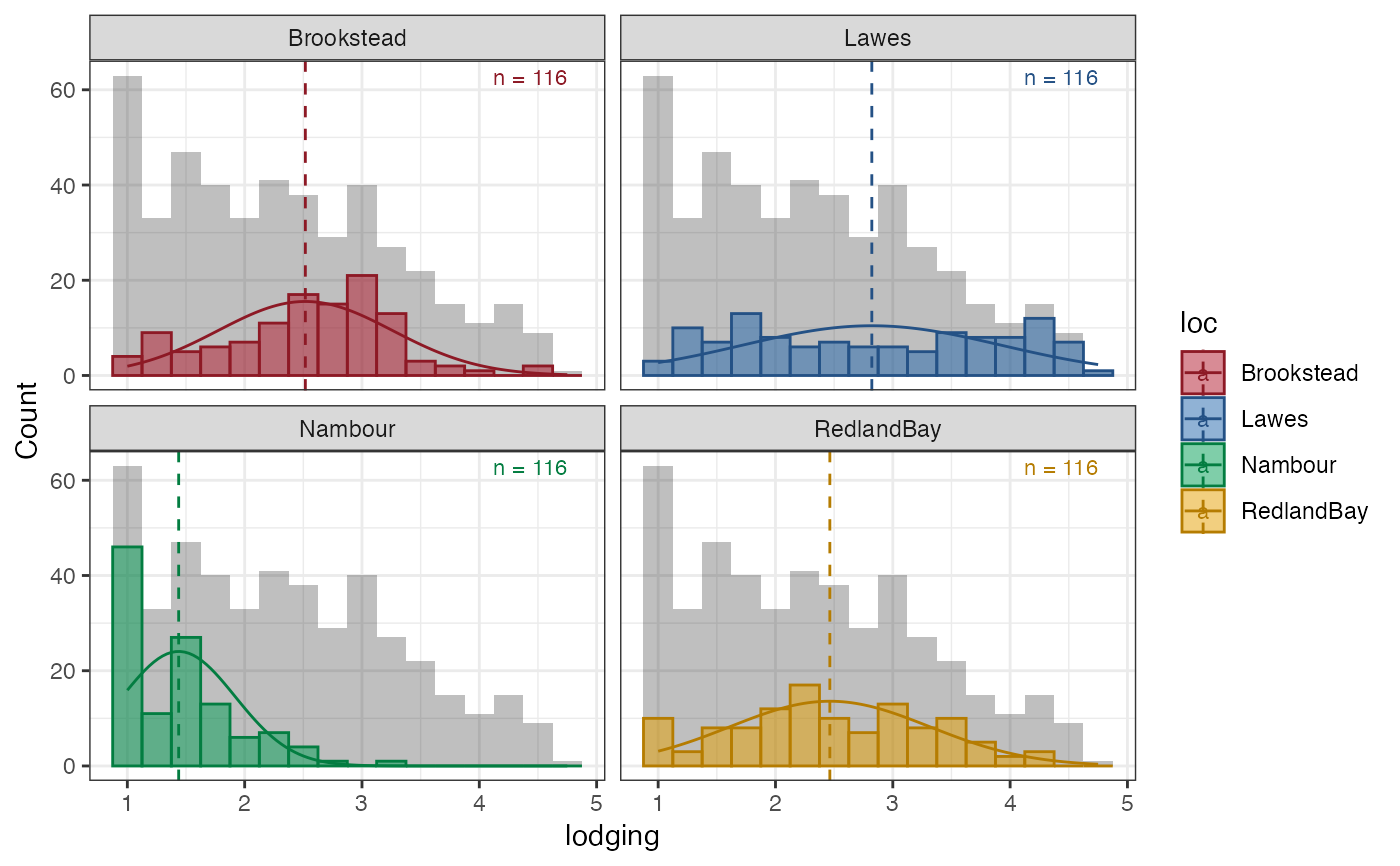
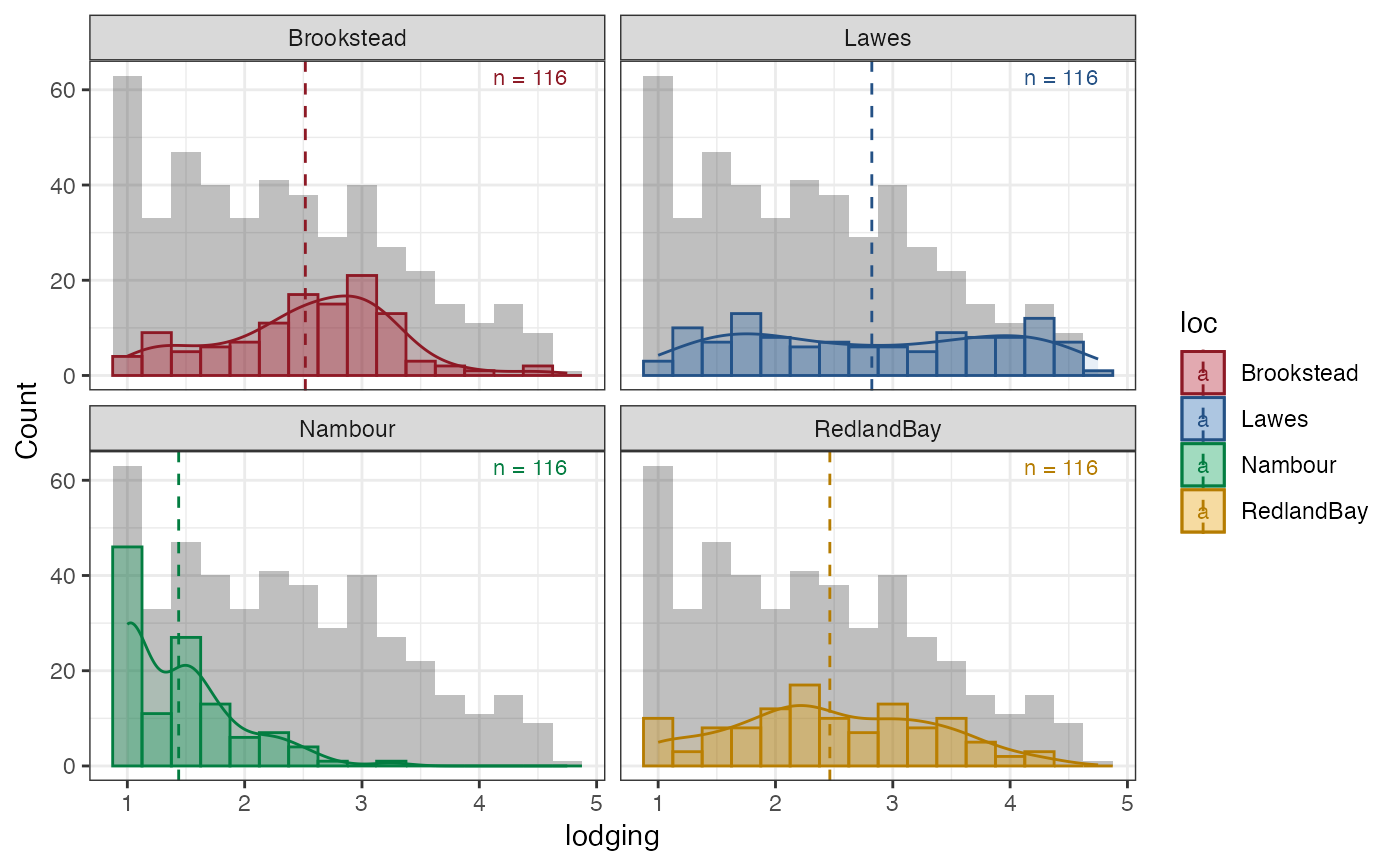
 # Group-wise histogram with facet ----
outg_hist_facet <-
groupwise_histogram(data = soydata, group = "loc", trait = "lodging",
background.hist = TRUE,
background.density = FALSE,
hist.alpha = 0.5,
density = FALSE,
subset = "facet")
outg_hist_facet
# Group-wise histogram with facet ----
outg_hist_facet <-
groupwise_histogram(data = soydata, group = "loc", trait = "lodging",
background.hist = TRUE,
background.density = FALSE,
hist.alpha = 0.5,
density = FALSE,
subset = "facet")
outg_hist_facet
 outg_hist_facet +
scale_fill_manual(values = clrs) +
scale_colour_manual(values = clrs_dark)
#> Scale for fill is already present.
#> Adding another scale for fill, which will replace the existing scale.
#> Scale for colour is already present.
#> Adding another scale for colour, which will replace the existing scale.
outg_hist_facet +
scale_fill_manual(values = clrs) +
scale_colour_manual(values = clrs_dark)
#> Scale for fill is already present.
#> Adding another scale for fill, which will replace the existing scale.
#> Scale for colour is already present.
#> Adding another scale for colour, which will replace the existing scale.
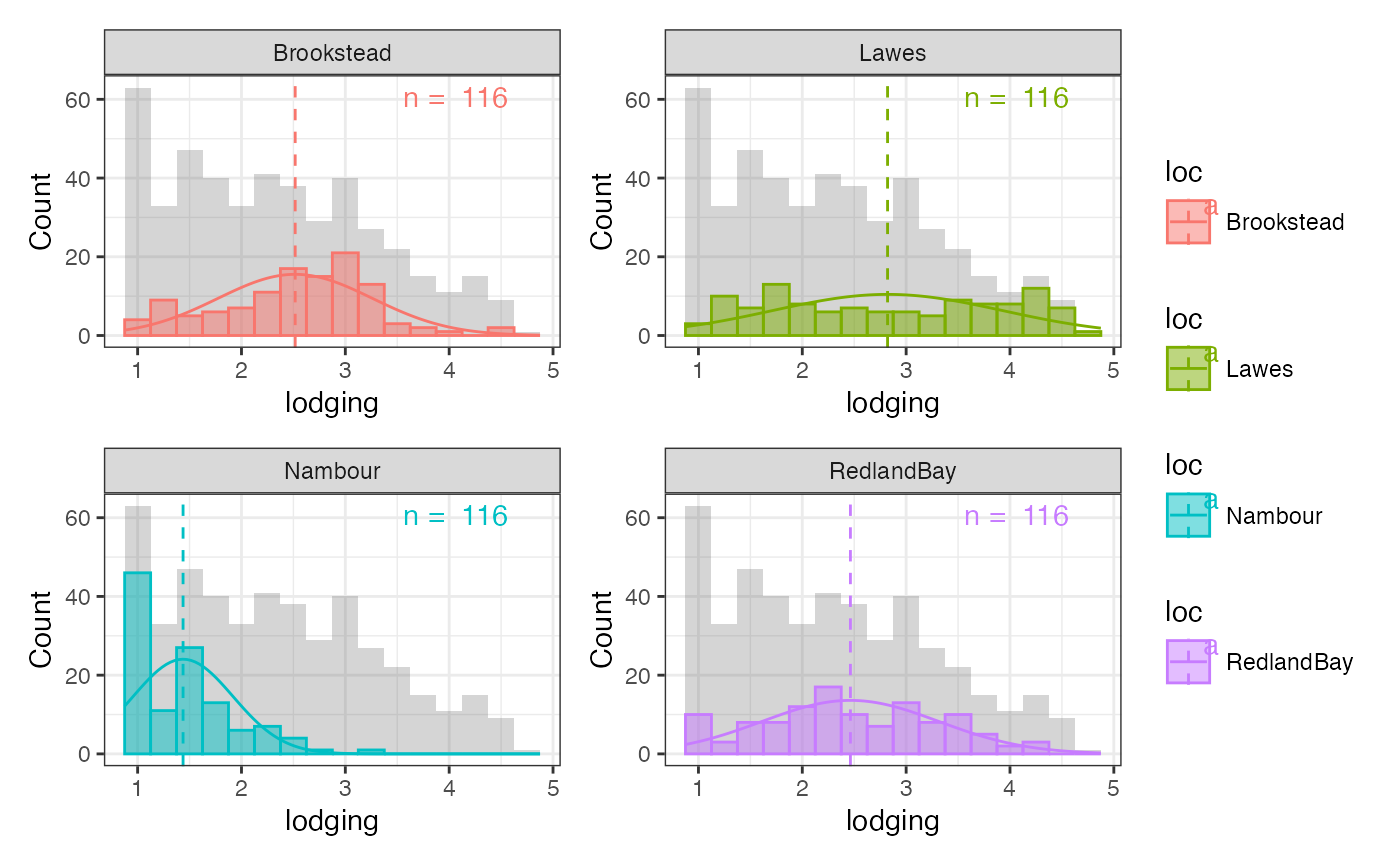
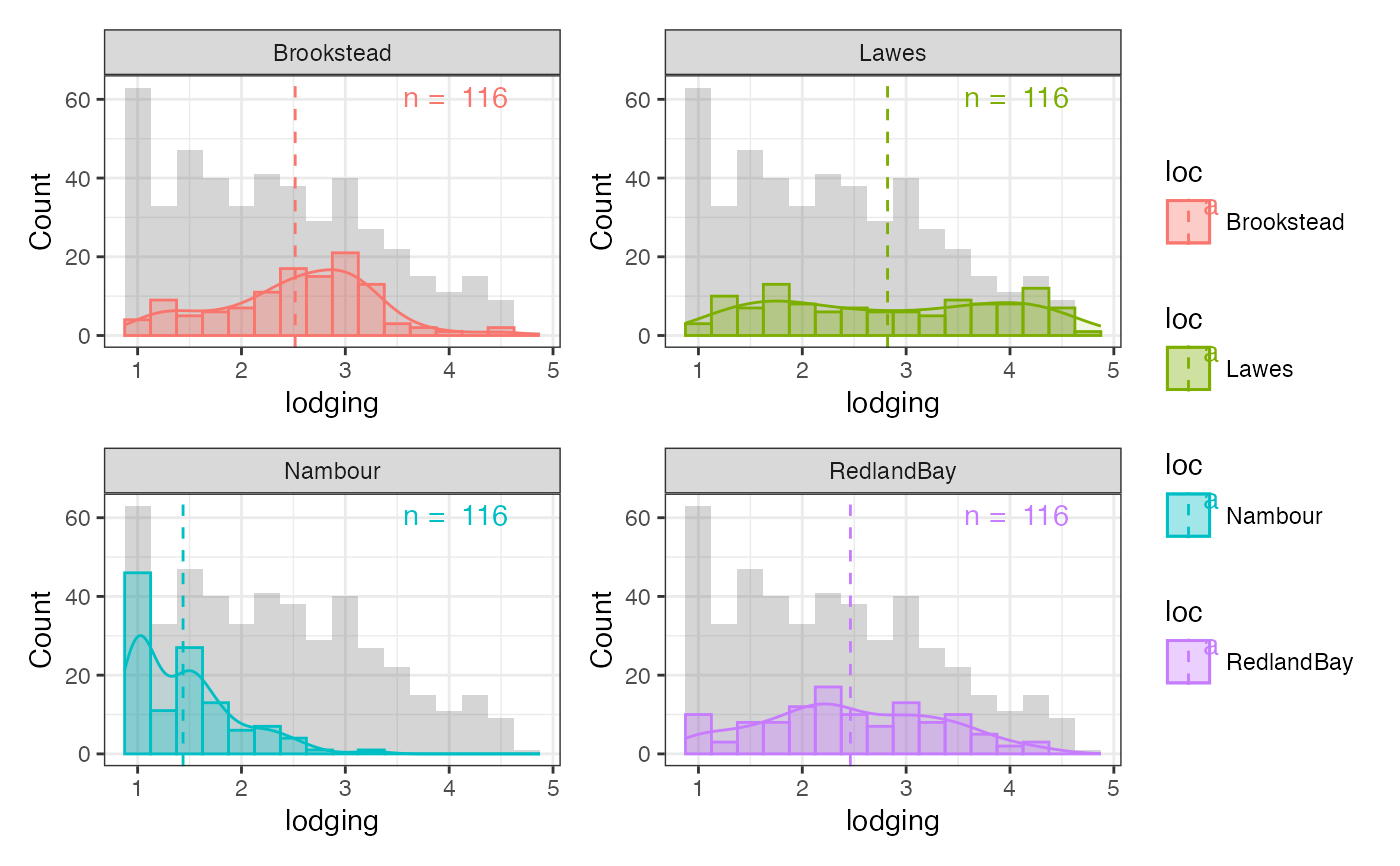
 # Group-wise histogram as list ----
outg_hist_list <-
groupwise_histogram(data = soydata, group = "loc", trait = "lodging",
background.hist = TRUE,
background.density = FALSE,
hist.alpha = 0.5,
density = FALSE,
subset = "list")
wrap_plots(outg_hist_list, nrow = 2, guides = "collect")
# Group-wise histogram as list ----
outg_hist_list <-
groupwise_histogram(data = soydata, group = "loc", trait = "lodging",
background.hist = TRUE,
background.density = FALSE,
hist.alpha = 0.5,
density = FALSE,
subset = "list")
wrap_plots(outg_hist_list, nrow = 2, guides = "collect")
 outg_hist_list <-
lapply(seq_along(outg_hist_list), function(i) {
outg_hist_list[[i]] +
scale_fill_manual(values = clrs[i]) +
scale_colour_manual(values = clrs_dark[i])
})
#> Scale for fill is already present.
#> Adding another scale for fill, which will replace the existing scale.
#> Scale for colour is already present.
#> Adding another scale for colour, which will replace the existing scale.
#> Scale for fill is already present.
#> Adding another scale for fill, which will replace the existing scale.
#> Scale for colour is already present.
#> Adding another scale for colour, which will replace the existing scale.
#> Scale for fill is already present.
#> Adding another scale for fill, which will replace the existing scale.
#> Scale for colour is already present.
#> Adding another scale for colour, which will replace the existing scale.
#> Scale for fill is already present.
#> Adding another scale for fill, which will replace the existing scale.
#> Scale for colour is already present.
#> Adding another scale for colour, which will replace the existing scale.
wrap_plots(outg_hist_list, nrow = 2, guides = "collect")
outg_hist_list <-
lapply(seq_along(outg_hist_list), function(i) {
outg_hist_list[[i]] +
scale_fill_manual(values = clrs[i]) +
scale_colour_manual(values = clrs_dark[i])
})
#> Scale for fill is already present.
#> Adding another scale for fill, which will replace the existing scale.
#> Scale for colour is already present.
#> Adding another scale for colour, which will replace the existing scale.
#> Scale for fill is already present.
#> Adding another scale for fill, which will replace the existing scale.
#> Scale for colour is already present.
#> Adding another scale for colour, which will replace the existing scale.
#> Scale for fill is already present.
#> Adding another scale for fill, which will replace the existing scale.
#> Scale for colour is already present.
#> Adding another scale for colour, which will replace the existing scale.
#> Scale for fill is already present.
#> Adding another scale for fill, which will replace the existing scale.
#> Scale for colour is already present.
#> Adding another scale for colour, which will replace the existing scale.
wrap_plots(outg_hist_list, nrow = 2, guides = "collect")
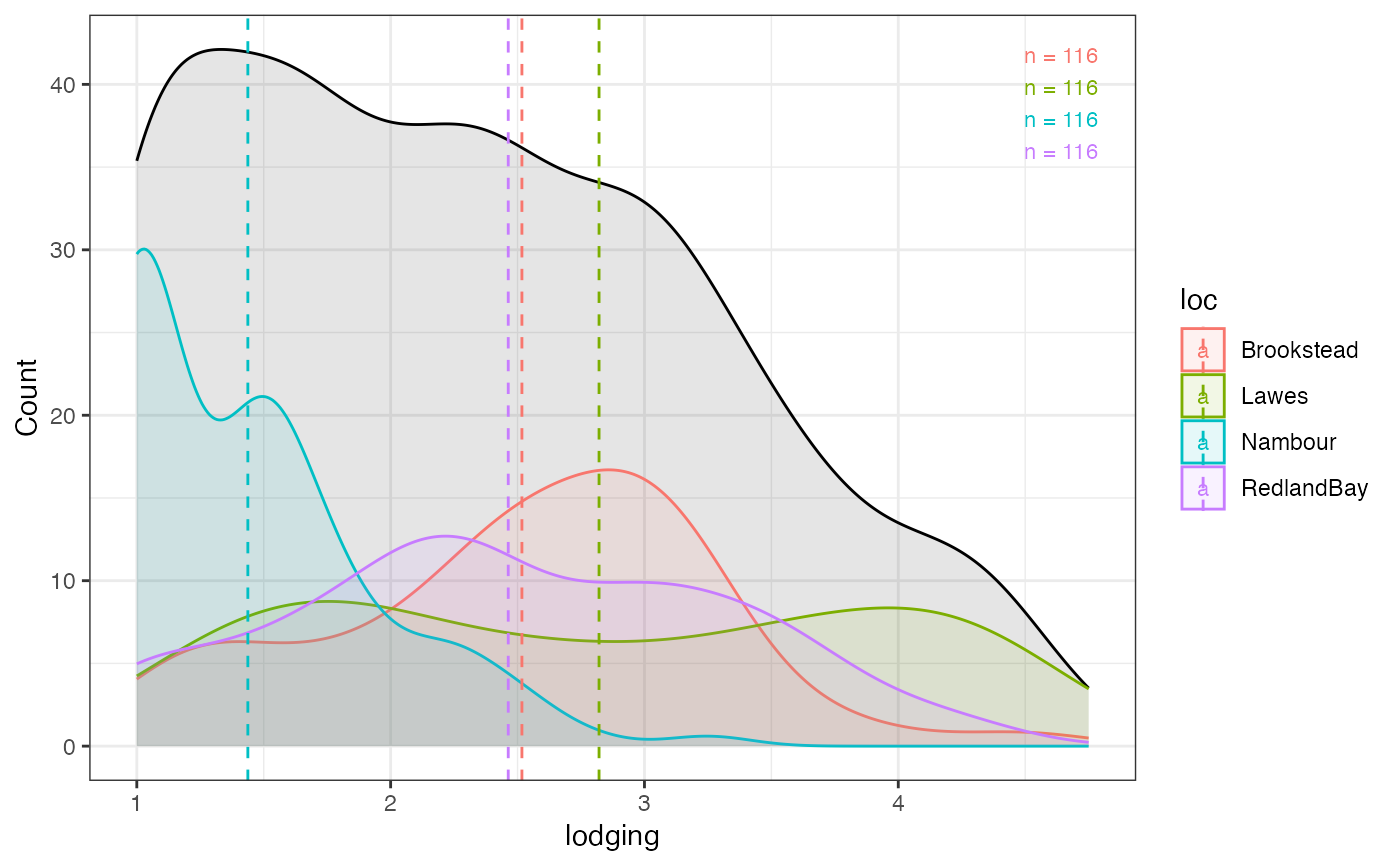
 # Group-wise density ----
outg_density <-
groupwise_histogram(data = soydata, group = "loc", trait = "lodging",
background.hist = FALSE,
background.density = TRUE,
hist = FALSE,
density = TRUE,
normal.curve = FALSE,
subset = "none")
outg_density
# Group-wise density ----
outg_density <-
groupwise_histogram(data = soydata, group = "loc", trait = "lodging",
background.hist = FALSE,
background.density = TRUE,
hist = FALSE,
density = TRUE,
normal.curve = FALSE,
subset = "none")
outg_density
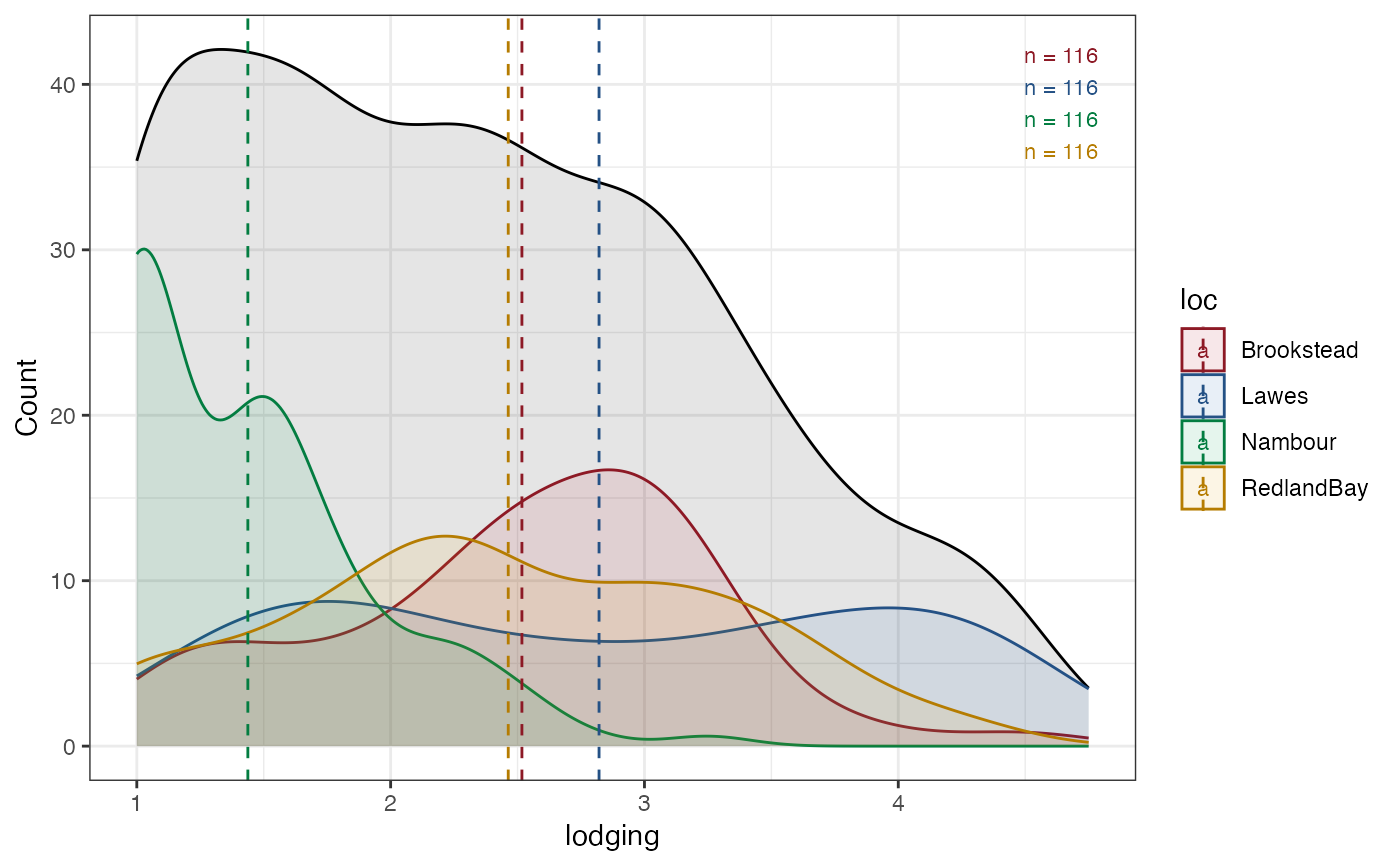
 outg_density +
scale_fill_manual(values = clrs) +
scale_colour_manual(values = clrs_dark)
#> Scale for fill is already present.
#> Adding another scale for fill, which will replace the existing scale.
#> Scale for colour is already present.
#> Adding another scale for colour, which will replace the existing scale.
outg_density +
scale_fill_manual(values = clrs) +
scale_colour_manual(values = clrs_dark)
#> Scale for fill is already present.
#> Adding another scale for fill, which will replace the existing scale.
#> Scale for colour is already present.
#> Adding another scale for colour, which will replace the existing scale.
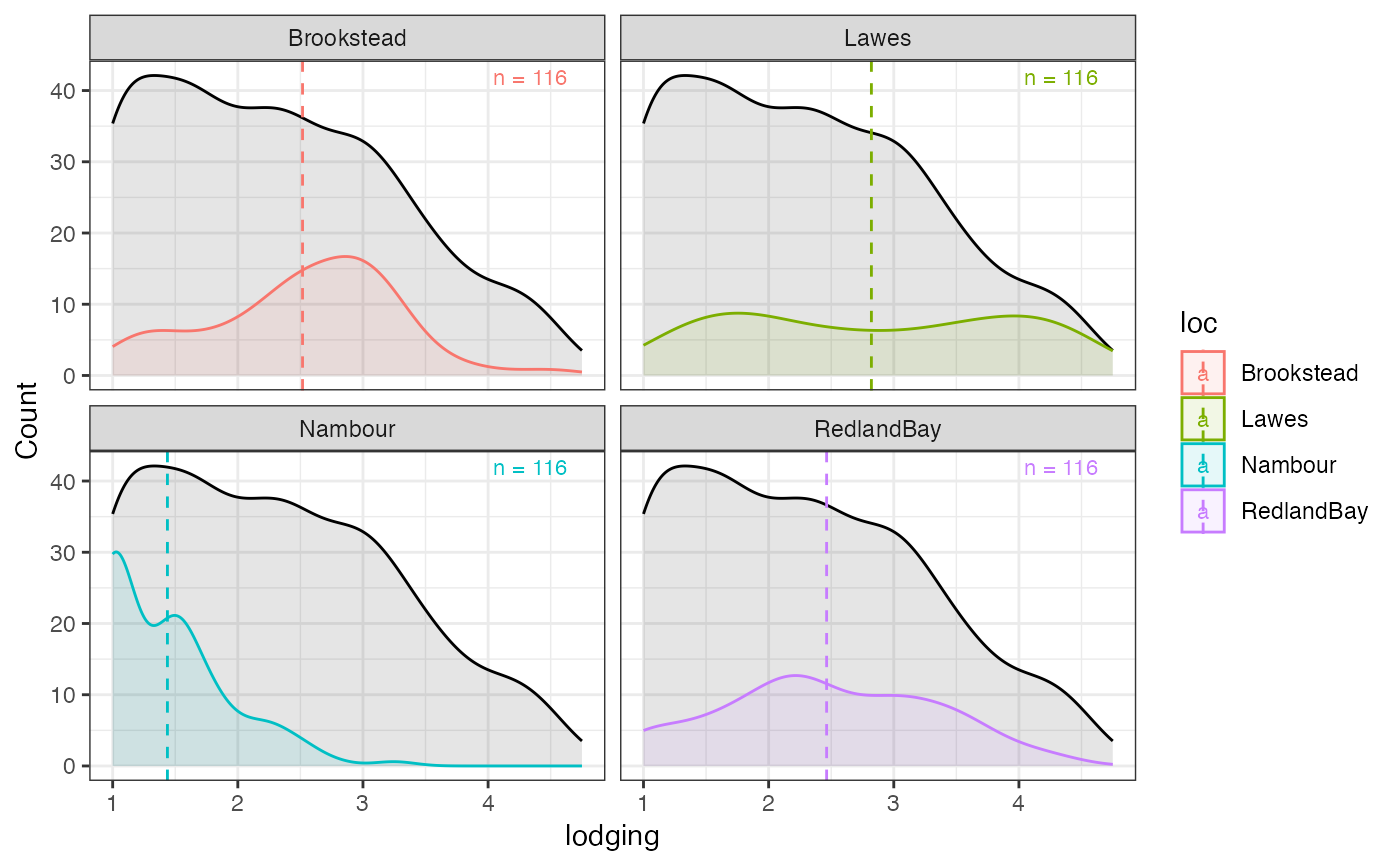
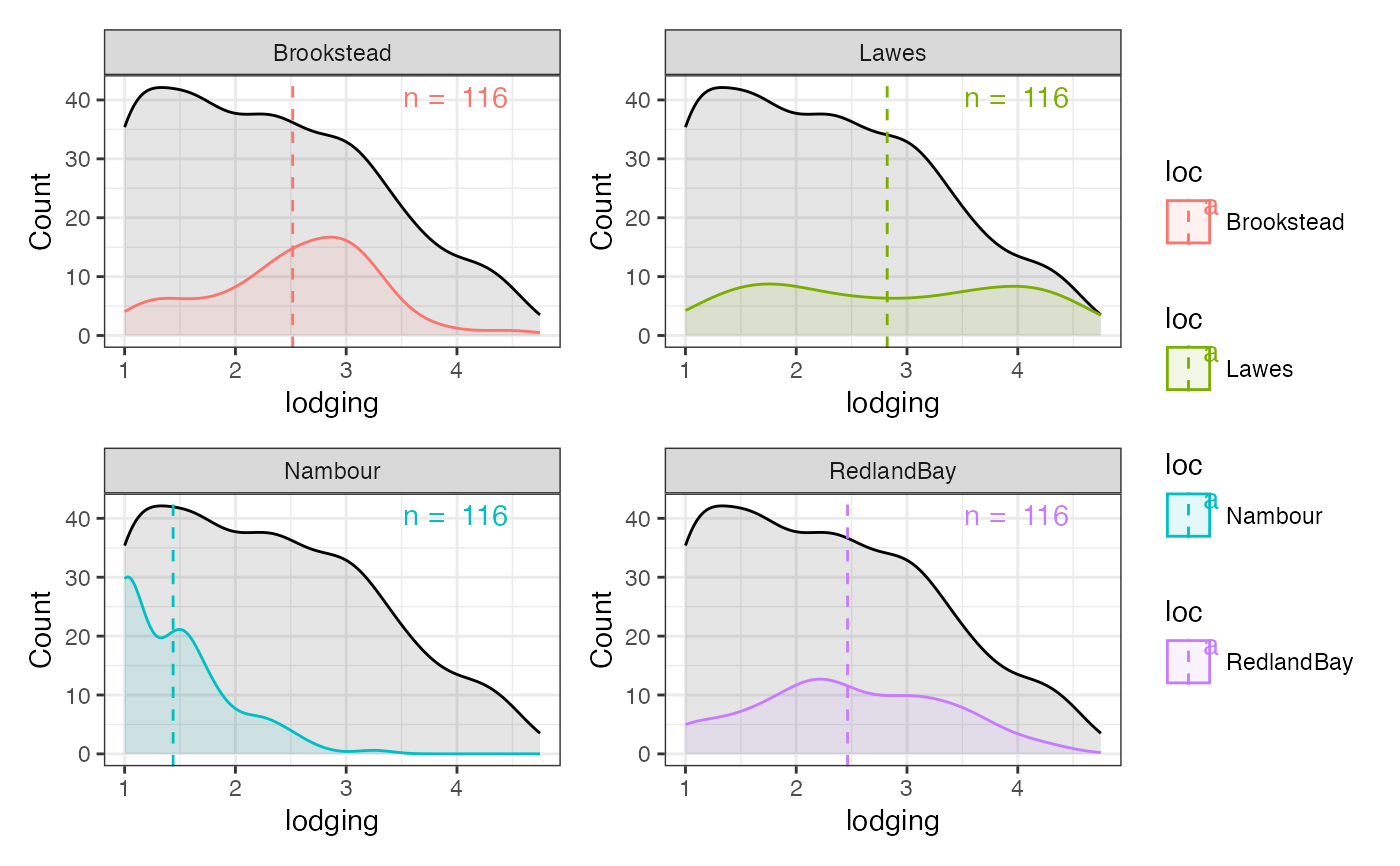
 # Group-wise density with facet ----
outg_density_facet <-
groupwise_histogram(data = soydata, group = "loc", trait = "lodging",
background.hist = FALSE,
background.density = TRUE,
hist = FALSE,
density = TRUE,
normal.curve = FALSE,
subset = "facet")
outg_density_facet
# Group-wise density with facet ----
outg_density_facet <-
groupwise_histogram(data = soydata, group = "loc", trait = "lodging",
background.hist = FALSE,
background.density = TRUE,
hist = FALSE,
density = TRUE,
normal.curve = FALSE,
subset = "facet")
outg_density_facet
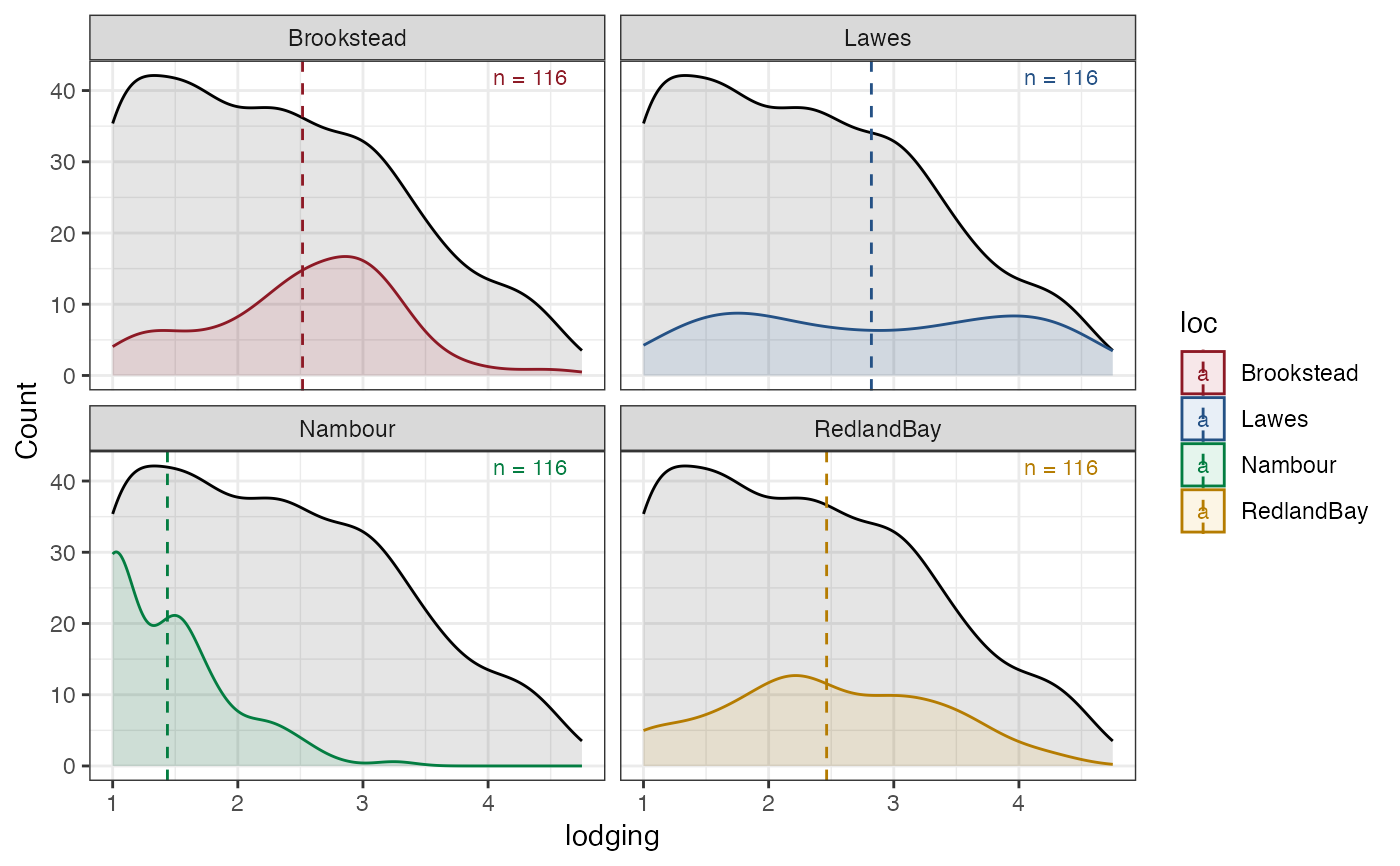
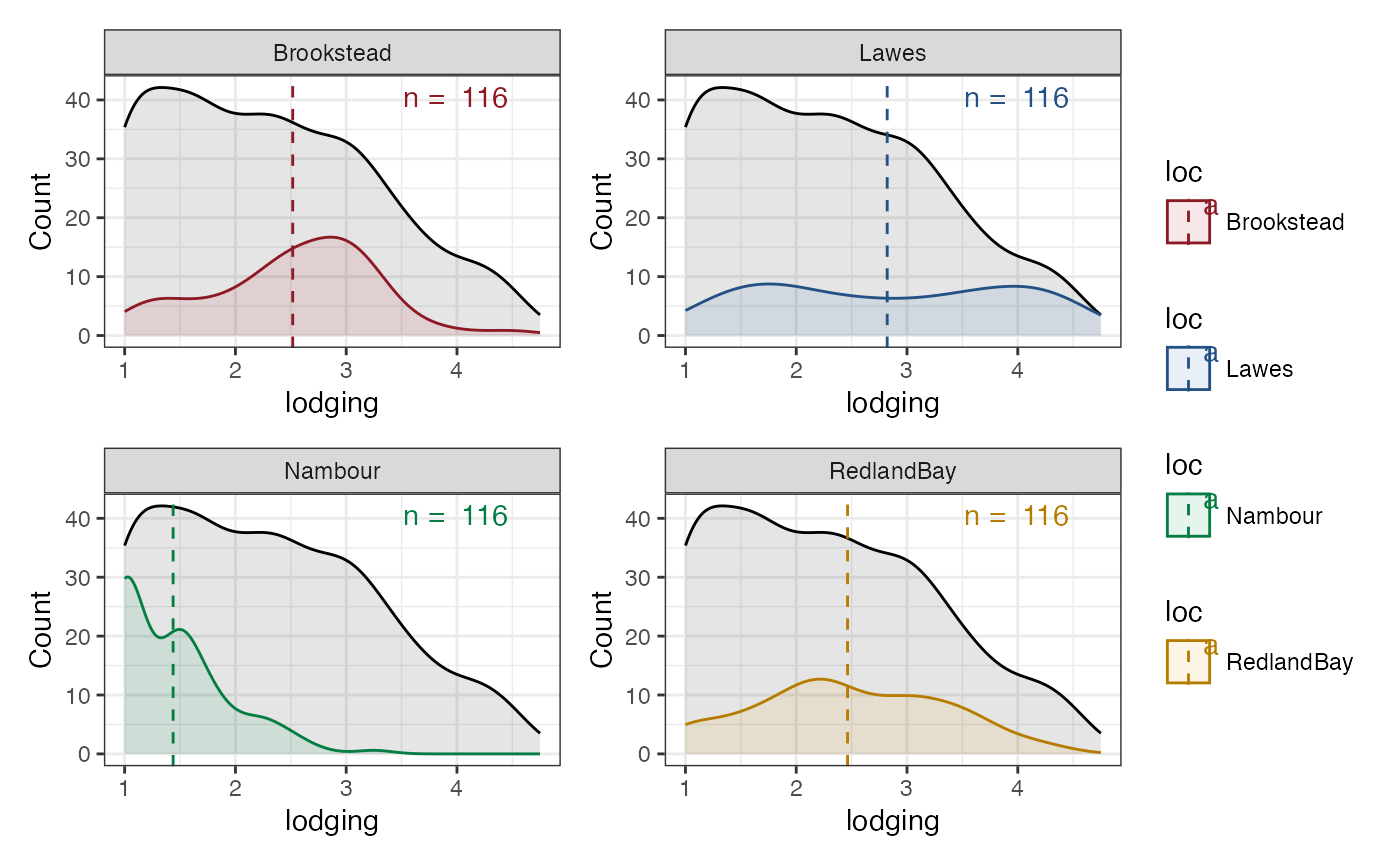
 outg_density_facet +
scale_fill_manual(values = clrs) +
scale_colour_manual(values = clrs_dark)
#> Scale for fill is already present.
#> Adding another scale for fill, which will replace the existing scale.
#> Scale for colour is already present.
#> Adding another scale for colour, which will replace the existing scale.
outg_density_facet +
scale_fill_manual(values = clrs) +
scale_colour_manual(values = clrs_dark)
#> Scale for fill is already present.
#> Adding another scale for fill, which will replace the existing scale.
#> Scale for colour is already present.
#> Adding another scale for colour, which will replace the existing scale.
 # Group-wise density as list ----
outg_density_list <-
groupwise_histogram(data = soydata, group = "loc", trait = "lodging",
background.hist = FALSE,
background.density = TRUE,
hist = FALSE,
density = TRUE,
normal.curve = FALSE,
subset = "list")
wrap_plots(outg_density_list, nrow = 2, guides = "collect")
# Group-wise density as list ----
outg_density_list <-
groupwise_histogram(data = soydata, group = "loc", trait = "lodging",
background.hist = FALSE,
background.density = TRUE,
hist = FALSE,
density = TRUE,
normal.curve = FALSE,
subset = "list")
wrap_plots(outg_density_list, nrow = 2, guides = "collect")
 outg_density_list <-
lapply(seq_along(outg_density_list), function(i) {
outg_density_list[[i]] +
scale_fill_manual(values = clrs[i]) +
scale_colour_manual(values = clrs_dark[i])
})
#> Scale for fill is already present.
#> Adding another scale for fill, which will replace the existing scale.
#> Scale for colour is already present.
#> Adding another scale for colour, which will replace the existing scale.
#> Scale for fill is already present.
#> Adding another scale for fill, which will replace the existing scale.
#> Scale for colour is already present.
#> Adding another scale for colour, which will replace the existing scale.
#> Scale for fill is already present.
#> Adding another scale for fill, which will replace the existing scale.
#> Scale for colour is already present.
#> Adding another scale for colour, which will replace the existing scale.
#> Scale for fill is already present.
#> Adding another scale for fill, which will replace the existing scale.
#> Scale for colour is already present.
#> Adding another scale for colour, which will replace the existing scale.
wrap_plots(outg_density_list, nrow = 2, guides = "collect")
outg_density_list <-
lapply(seq_along(outg_density_list), function(i) {
outg_density_list[[i]] +
scale_fill_manual(values = clrs[i]) +
scale_colour_manual(values = clrs_dark[i])
})
#> Scale for fill is already present.
#> Adding another scale for fill, which will replace the existing scale.
#> Scale for colour is already present.
#> Adding another scale for colour, which will replace the existing scale.
#> Scale for fill is already present.
#> Adding another scale for fill, which will replace the existing scale.
#> Scale for colour is already present.
#> Adding another scale for colour, which will replace the existing scale.
#> Scale for fill is already present.
#> Adding another scale for fill, which will replace the existing scale.
#> Scale for colour is already present.
#> Adding another scale for colour, which will replace the existing scale.
#> Scale for fill is already present.
#> Adding another scale for fill, which will replace the existing scale.
#> Scale for colour is already present.
#> Adding another scale for colour, which will replace the existing scale.
wrap_plots(outg_density_list, nrow = 2, guides = "collect")
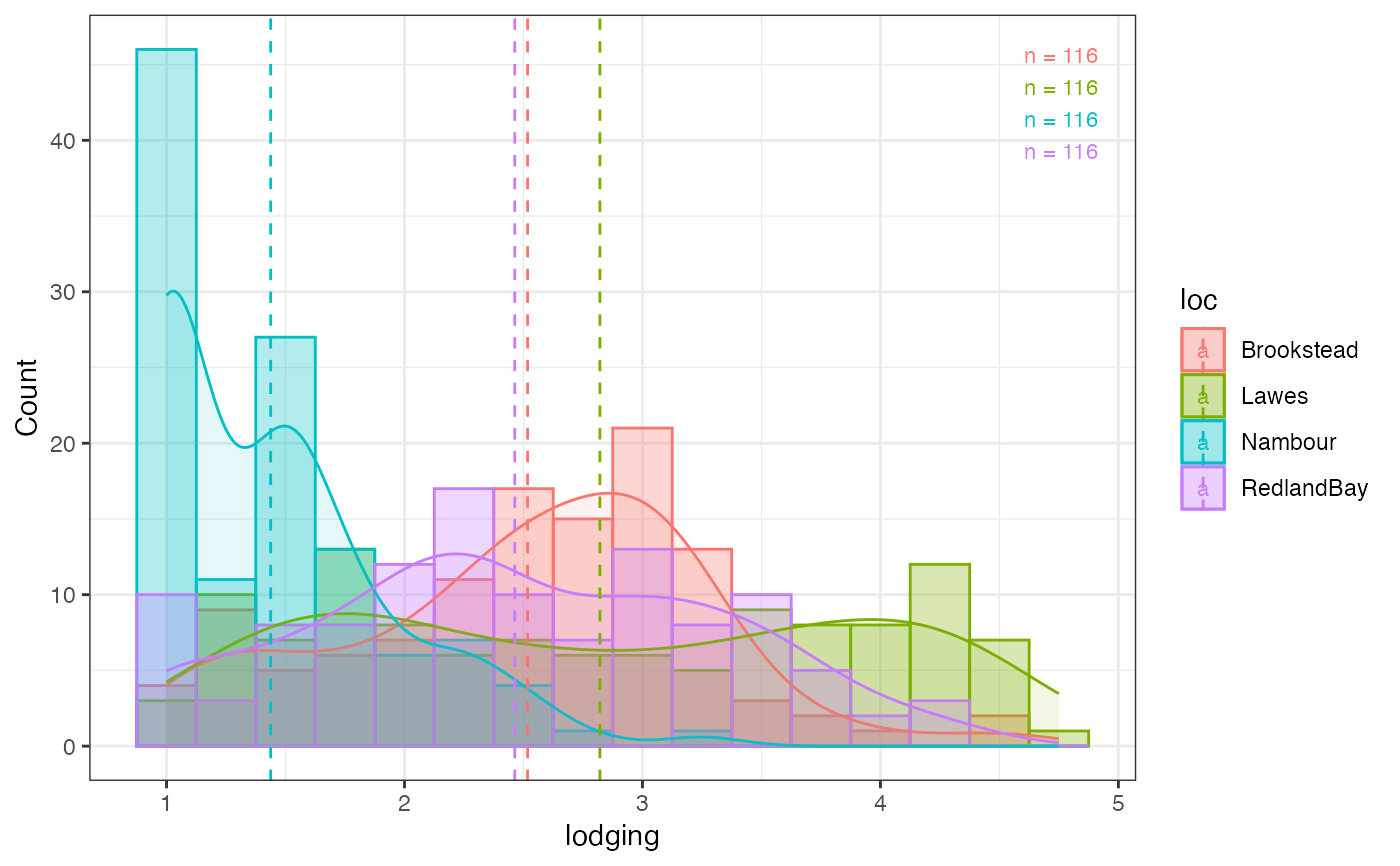
 # Group-wise density + histogram ----
outg_density_hist <-
groupwise_histogram(data = soydata, group = "loc", trait = "lodging",
background.hist = FALSE,
background.density = FALSE,
hist = TRUE,
hist.alpha = 0.3,
density = TRUE,
normal.curve = FALSE,
subset = "none")
outg_density_hist
# Group-wise density + histogram ----
outg_density_hist <-
groupwise_histogram(data = soydata, group = "loc", trait = "lodging",
background.hist = FALSE,
background.density = FALSE,
hist = TRUE,
hist.alpha = 0.3,
density = TRUE,
normal.curve = FALSE,
subset = "none")
outg_density_hist
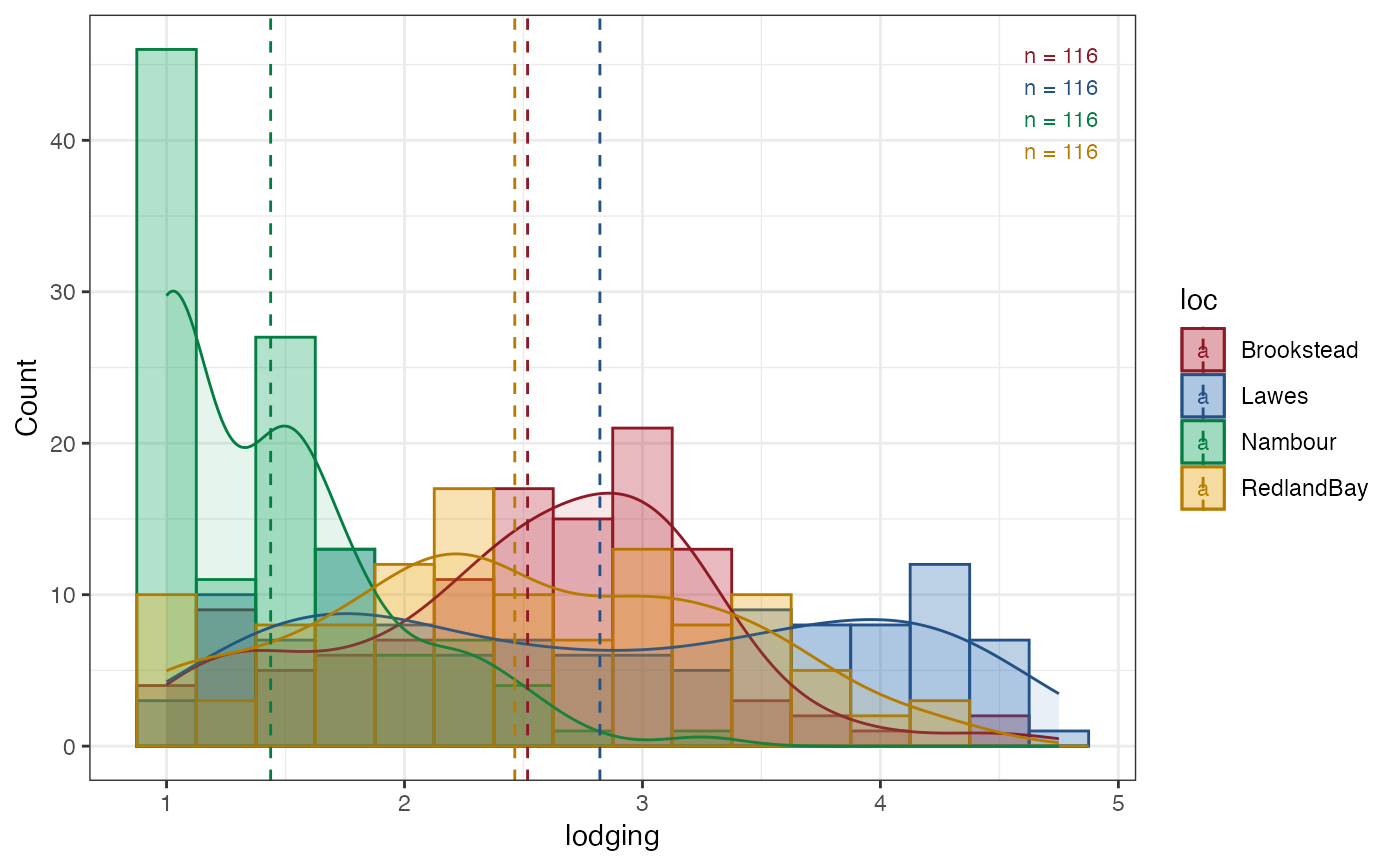
 outg_density_hist +
scale_fill_manual(values = clrs) +
scale_colour_manual(values = clrs_dark)
#> Scale for fill is already present.
#> Adding another scale for fill, which will replace the existing scale.
#> Scale for colour is already present.
#> Adding another scale for colour, which will replace the existing scale.
outg_density_hist +
scale_fill_manual(values = clrs) +
scale_colour_manual(values = clrs_dark)
#> Scale for fill is already present.
#> Adding another scale for fill, which will replace the existing scale.
#> Scale for colour is already present.
#> Adding another scale for colour, which will replace the existing scale.
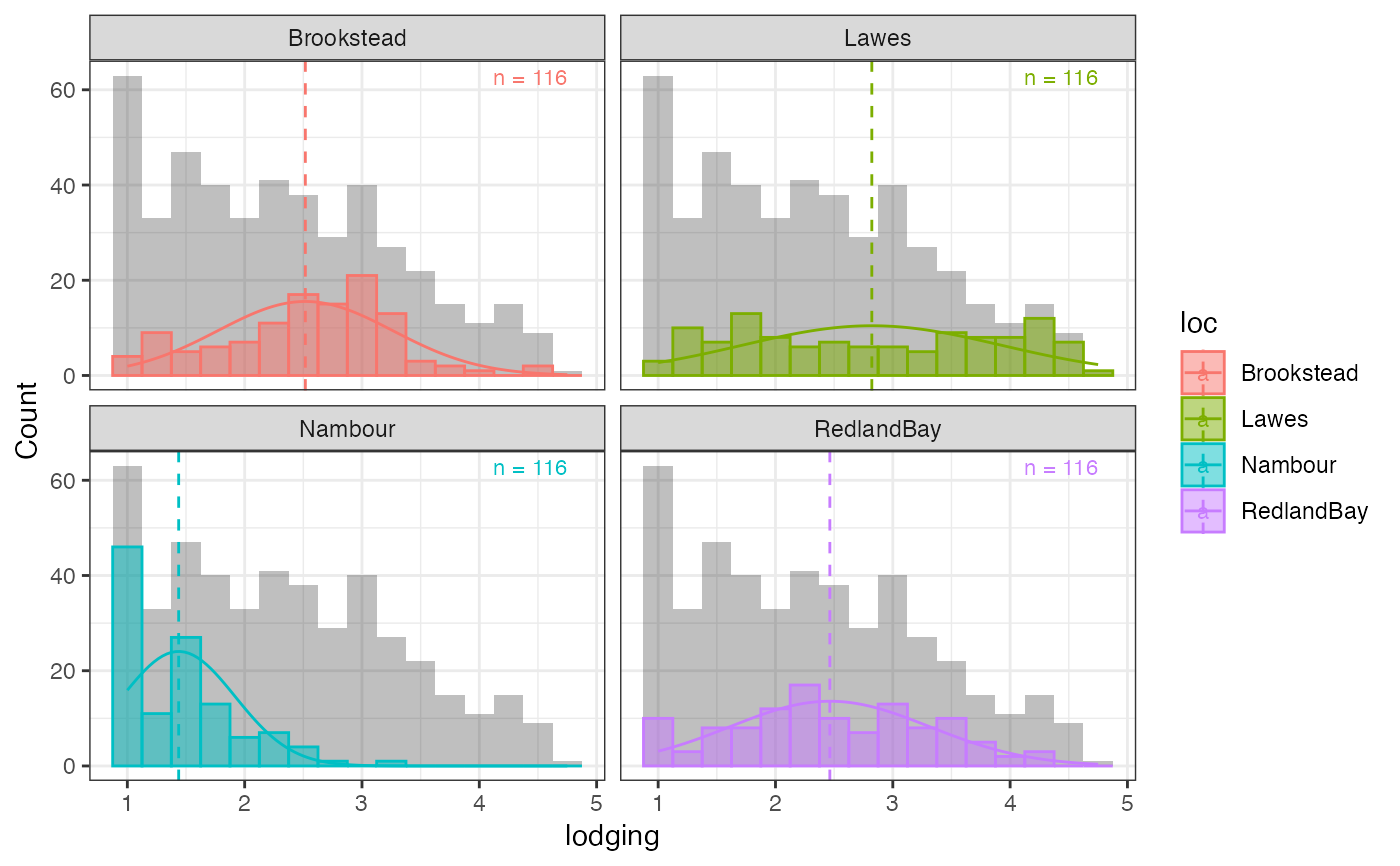
 # Group-wise density + histogram with facet ----
outg_density_hist_facet <-
groupwise_histogram(data = soydata, group = "loc", trait = "lodging",
background.hist = TRUE,
background.density = FALSE,
hist = TRUE,
hist.alpha = 0.3,
density = TRUE,
normal.curve = FALSE,
subset = "facet")
outg_density_hist_facet
# Group-wise density + histogram with facet ----
outg_density_hist_facet <-
groupwise_histogram(data = soydata, group = "loc", trait = "lodging",
background.hist = TRUE,
background.density = FALSE,
hist = TRUE,
hist.alpha = 0.3,
density = TRUE,
normal.curve = FALSE,
subset = "facet")
outg_density_hist_facet
 outg_density_hist_facet +
scale_fill_manual(values = clrs) +
scale_colour_manual(values = clrs_dark)
#> Scale for fill is already present.
#> Adding another scale for fill, which will replace the existing scale.
#> Scale for colour is already present.
#> Adding another scale for colour, which will replace the existing scale.
outg_density_hist_facet +
scale_fill_manual(values = clrs) +
scale_colour_manual(values = clrs_dark)
#> Scale for fill is already present.
#> Adding another scale for fill, which will replace the existing scale.
#> Scale for colour is already present.
#> Adding another scale for colour, which will replace the existing scale.
 # Group-wise density + histogram as list ----
outg_density_hist_list <-
groupwise_histogram(data = soydata, group = "loc", trait = "lodging",
background.hist = TRUE,
background.density = FALSE,
hist = TRUE,
hist.alpha = 0.3,
density = TRUE,
normal.curve = FALSE,
subset = "list")
wrap_plots(outg_density_hist_list, nrow = 2, guides = "collect")
# Group-wise density + histogram as list ----
outg_density_hist_list <-
groupwise_histogram(data = soydata, group = "loc", trait = "lodging",
background.hist = TRUE,
background.density = FALSE,
hist = TRUE,
hist.alpha = 0.3,
density = TRUE,
normal.curve = FALSE,
subset = "list")
wrap_plots(outg_density_hist_list, nrow = 2, guides = "collect")
 outg_density_hist_list <-
lapply(seq_along(outg_density_hist_list), function(i) {
outg_density_hist_list[[i]] +
scale_fill_manual(values = clrs[i]) +
scale_colour_manual(values = clrs_dark[i])
})
#> Scale for fill is already present.
#> Adding another scale for fill, which will replace the existing scale.
#> Scale for colour is already present.
#> Adding another scale for colour, which will replace the existing scale.
#> Scale for fill is already present.
#> Adding another scale for fill, which will replace the existing scale.
#> Scale for colour is already present.
#> Adding another scale for colour, which will replace the existing scale.
#> Scale for fill is already present.
#> Adding another scale for fill, which will replace the existing scale.
#> Scale for colour is already present.
#> Adding another scale for colour, which will replace the existing scale.
#> Scale for fill is already present.
#> Adding another scale for fill, which will replace the existing scale.
#> Scale for colour is already present.
#> Adding another scale for colour, which will replace the existing scale.
wrap_plots(outg_density_hist_list, nrow = 2, guides = "collect")
outg_density_hist_list <-
lapply(seq_along(outg_density_hist_list), function(i) {
outg_density_hist_list[[i]] +
scale_fill_manual(values = clrs[i]) +
scale_colour_manual(values = clrs_dark[i])
})
#> Scale for fill is already present.
#> Adding another scale for fill, which will replace the existing scale.
#> Scale for colour is already present.
#> Adding another scale for colour, which will replace the existing scale.
#> Scale for fill is already present.
#> Adding another scale for fill, which will replace the existing scale.
#> Scale for colour is already present.
#> Adding another scale for colour, which will replace the existing scale.
#> Scale for fill is already present.
#> Adding another scale for fill, which will replace the existing scale.
#> Scale for colour is already present.
#> Adding another scale for colour, which will replace the existing scale.
#> Scale for fill is already present.
#> Adding another scale for fill, which will replace the existing scale.
#> Scale for colour is already present.
#> Adding another scale for colour, which will replace the existing scale.
wrap_plots(outg_density_hist_list, nrow = 2, guides = "collect")