Plot the four-parameter hill function fitted cumulative germination curve from a FourPHFfit object
Source: R/plot.FourPHFfit.R
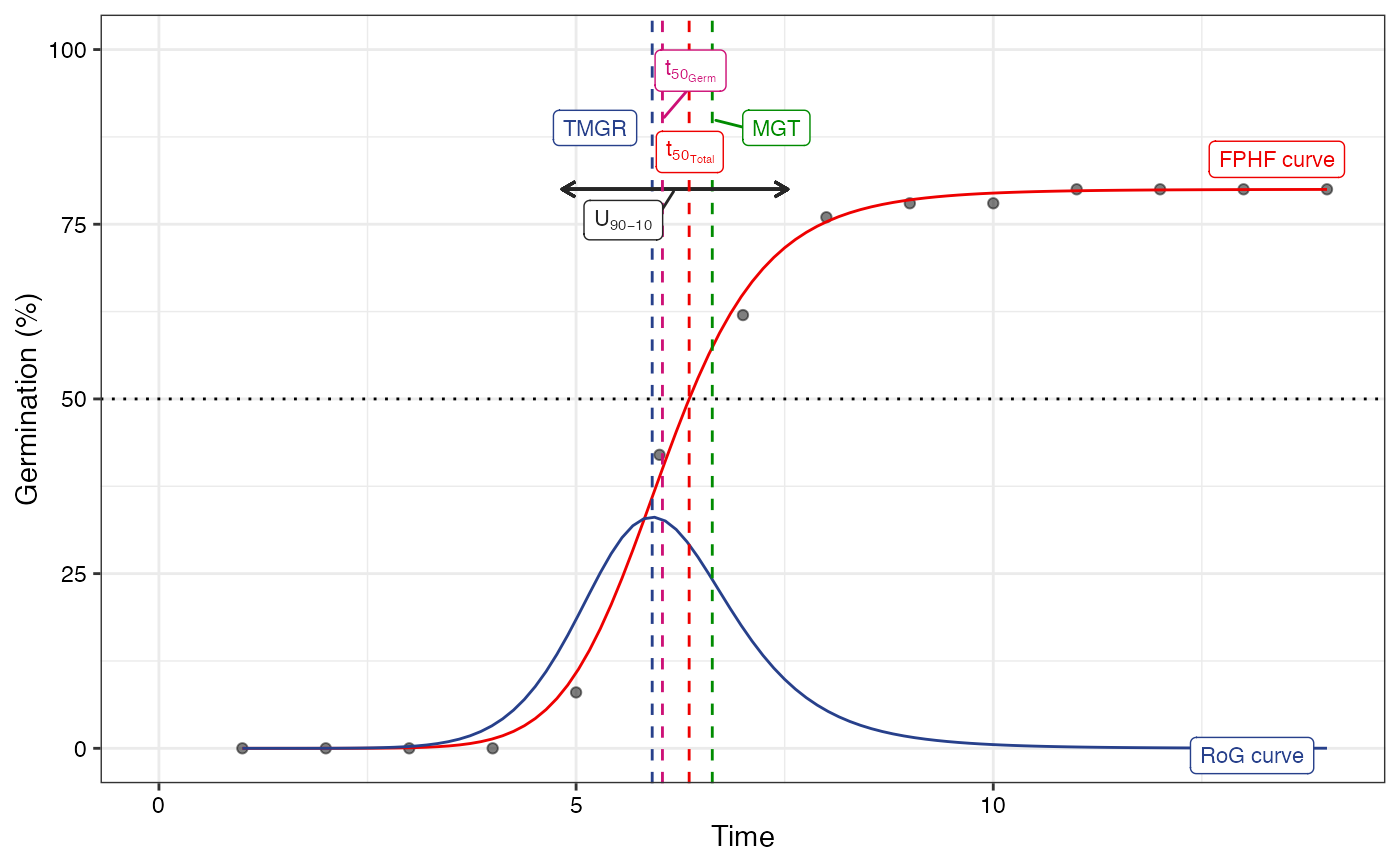
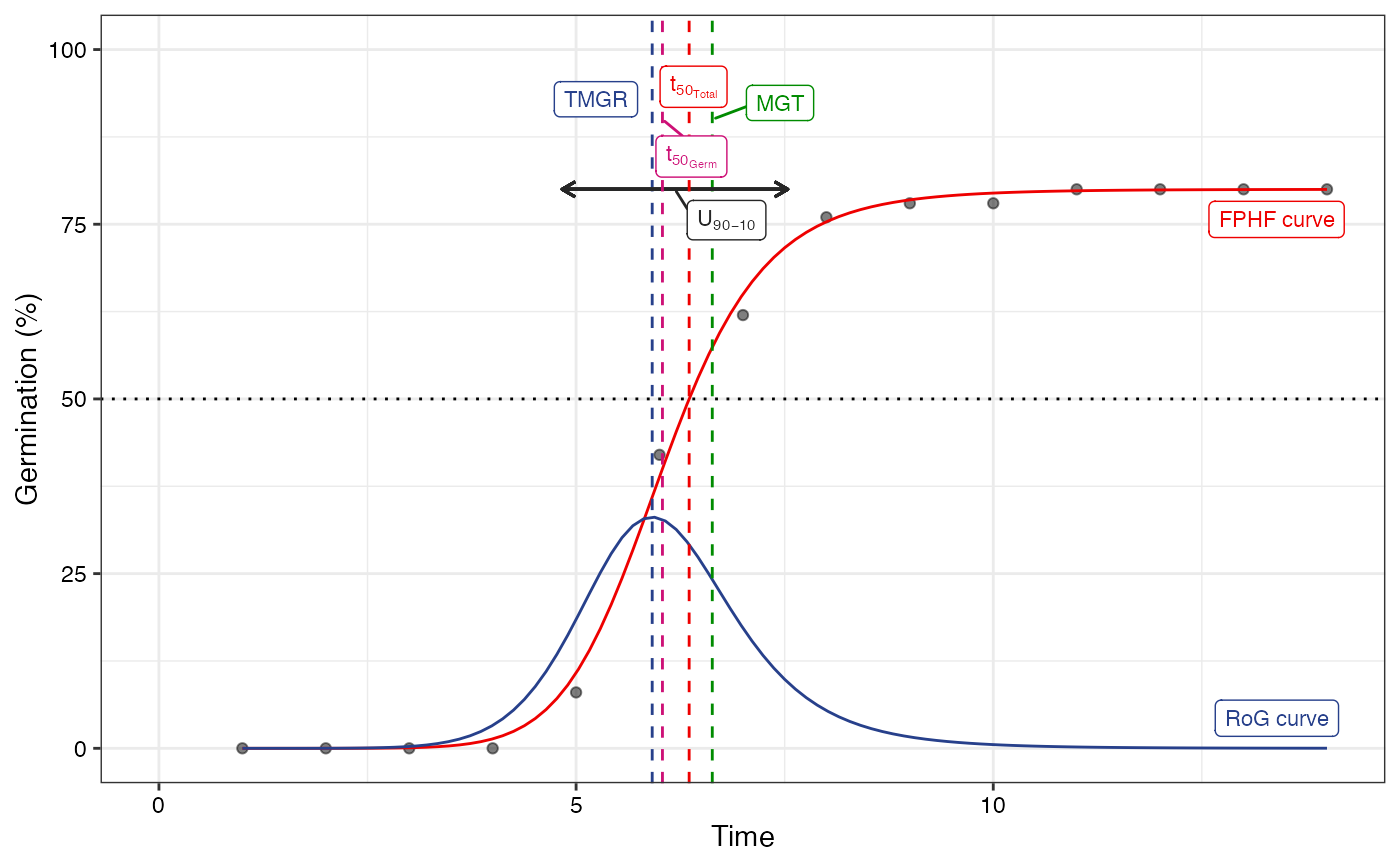
plot.FourPHFfit.Rdplot.FourPHFfit plots the four-parameter hill function fitted
cumulative germination curve (FPHF curve) from a FourPHFfit object as
an object of class ggplot. Further, the rate of germination curve (RoG
curve) is plotted and different parameters annotated as specified in the
different arguments.
Usage
# S3 method for class 'FourPHFfit'
plot(
  x,
  rog = TRUE,
  t50.total = TRUE,
  t50.germ = TRUE,
  tmgr = TRUE,
  mgt = TRUE,
  uniformity = TRUE,
  limits = TRUE,
  plotlabels = TRUE,
  ...
)
Arguments
- x
An object of class
FourPHFfitobtained as output from theFourPHFfitfunction.- rog
If
TRUE, plots the Rate of Germination curve (RoG). Default isTRUE.- t50.total
If
TRUE, highlights the time required for 50% of total seeds to germinate (\(\textrm{t}_{\textrm{50}_\textrm{Total}}\)) as a vertical line. Default isTRUE.- t50.germ
If
TRUE, highlights the time required for 50% of viable/germinated seeds to germinate (\(\textrm{t}_{\textrm{50}_\textrm{Germ}}\)) as a vertical line. Default isTRUE.- tmgr
If
TRUE, highlights the Time at Maximum Germination Rate (TMGR) as a vertical line. Default isTRUE.- mgt
If
TRUE, highlights the Mean Germination Time (MGT) as a vertical line. Default isTRUE.- uniformity
If
TRUE, highlights the uniformity value (\(\textrm{U}_{\textrm{t}_{\textrm{max}}-\textrm{t}_{\textrm{min}}}\)) as a horizontal line. Default isTRUE.- limits
logical. If
TRUE, set the limits of y axis (germination percentage) between 0 and 100 in the germination curve plot. IfFALSE, limits are set according to the data. Default isTRUE.- plotlabels
logical. If
TRUE, adds labels to the germination curve plot. Default isTRUE.- ...
Default plot arguments.
Examples
# \donttest{
x <- c(0, 0, 0, 0, 4, 17, 10, 7, 1, 0, 1, 0, 0, 0)
y <- c(0, 0, 0, 0, 4, 21, 31, 38, 39, 39, 40, 40, 40, 40)
int <- 1:length(x)
total.seeds = 50
# From partial germination counts
#----------------------------------------------------------------------------
fit1 <- FourPHFfit(germ.counts = x, intervals = int,
total.seeds = 50, tmax = 20)
# From cumulative germination counts
#----------------------------------------------------------------------------
fit2 <- FourPHFfit(germ.counts = y, intervals = int,
total.seeds = 50, tmax = 20, partial = FALSE)
# Default plots
plot(fit1)
#> Warning: All aesthetics have length 1, but the data has 14 rows.
#> ℹ Please consider using `annotate()` or provide this layer with data containing
#> a single row.
#> Warning: All aesthetics have length 1, but the data has 14 rows.
#> ℹ Please consider using `annotate()` or provide this layer with data containing
#> a single row.
 plot(fit2)
#> Warning: All aesthetics have length 1, but the data has 14 rows.
#> ℹ Please consider using `annotate()` or provide this layer with data containing
#> a single row.
#> Warning: All aesthetics have length 1, but the data has 14 rows.
#> ℹ Please consider using `annotate()` or provide this layer with data containing
#> a single row.
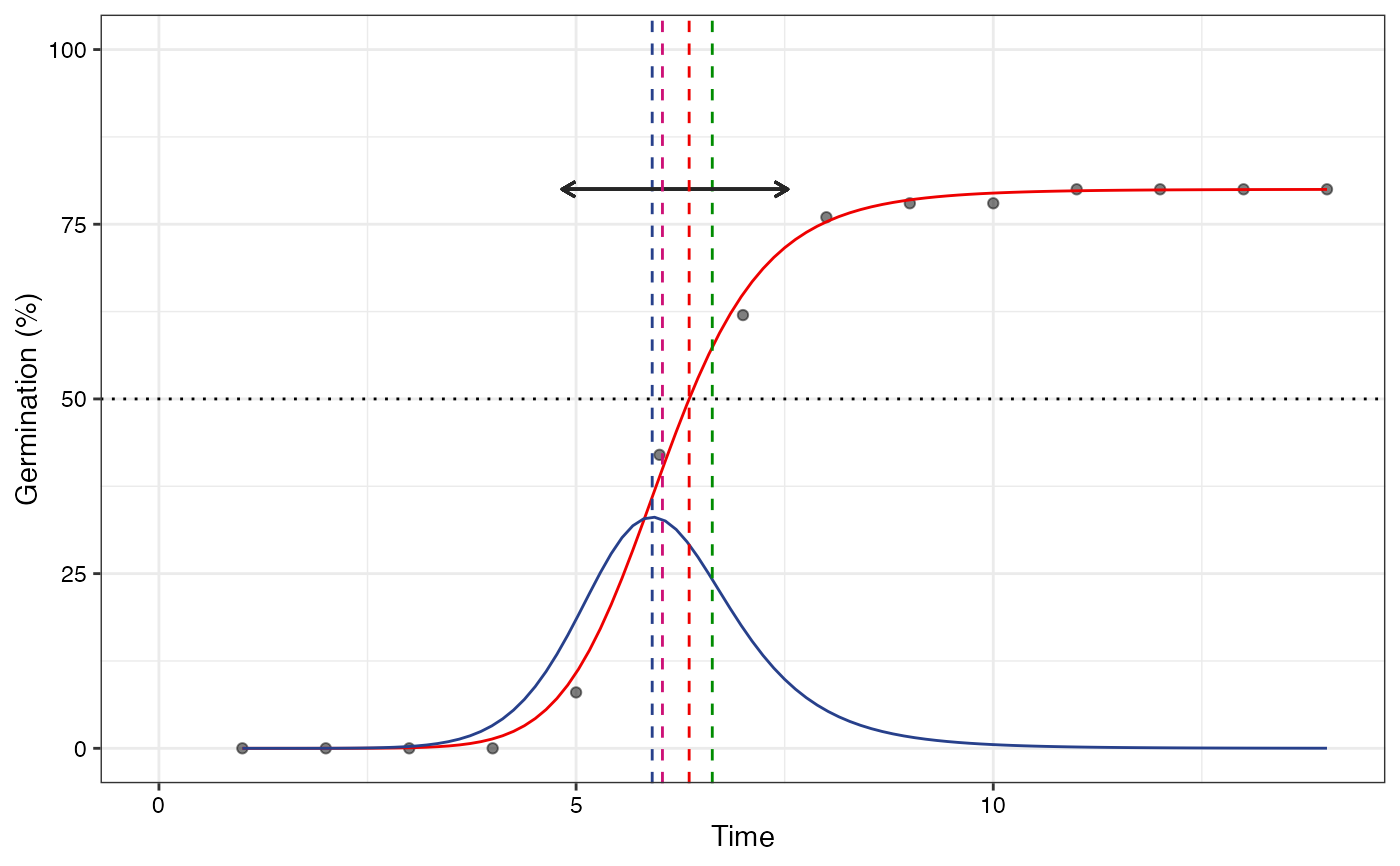
 # No labels
plot(fit1, plotlabels = FALSE)
#> Warning: All aesthetics have length 1, but the data has 14 rows.
#> ℹ Please consider using `annotate()` or provide this layer with data containing
#> a single row.
#> Warning: All aesthetics have length 1, but the data has 14 rows.
#> ℹ Please consider using `annotate()` or provide this layer with data containing
#> a single row.
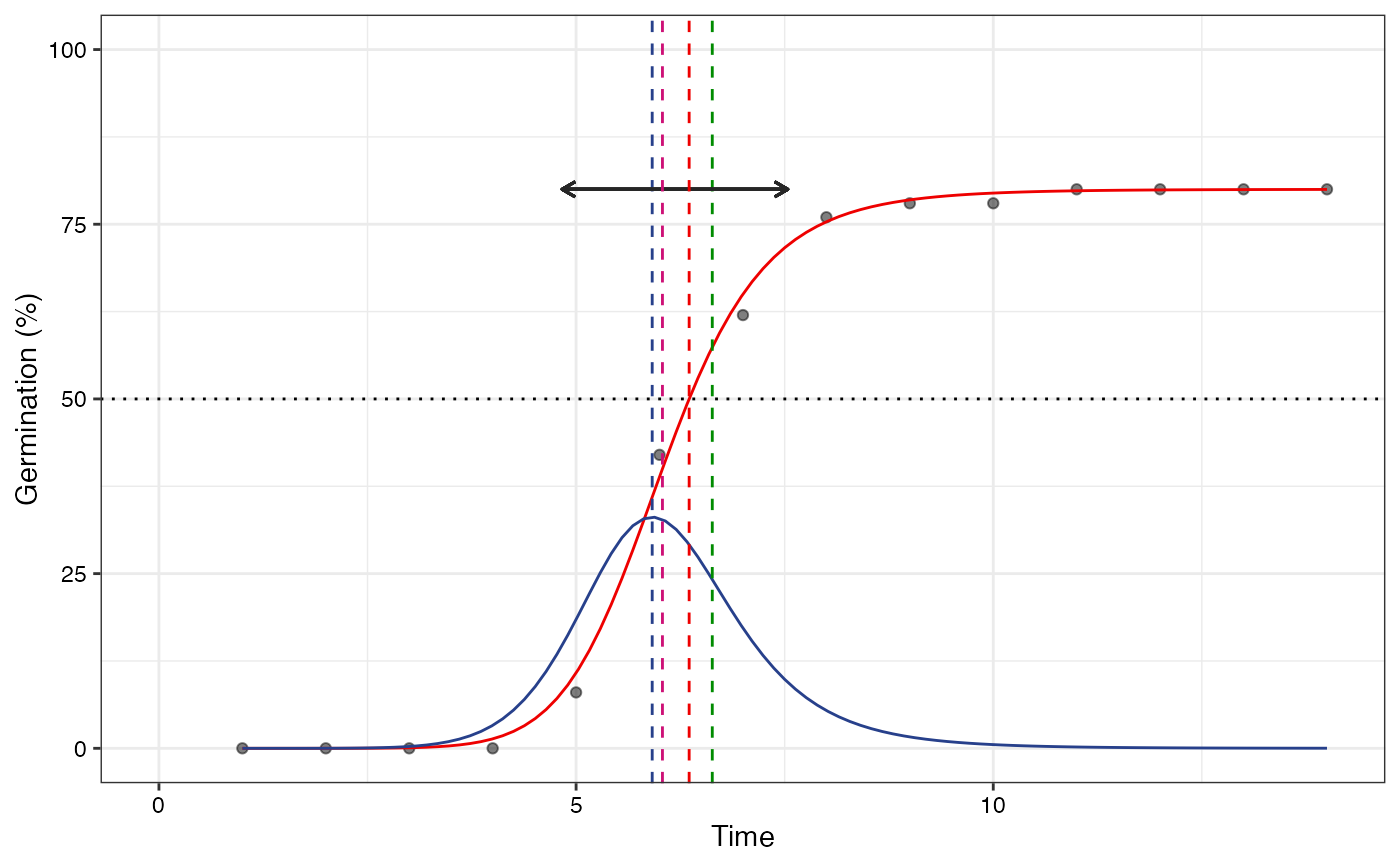
 plot(fit2, plotlabels = FALSE)
#> Warning: All aesthetics have length 1, but the data has 14 rows.
#> ℹ Please consider using `annotate()` or provide this layer with data containing
#> a single row.
#> Warning: All aesthetics have length 1, but the data has 14 rows.
#> ℹ Please consider using `annotate()` or provide this layer with data containing
#> a single row.
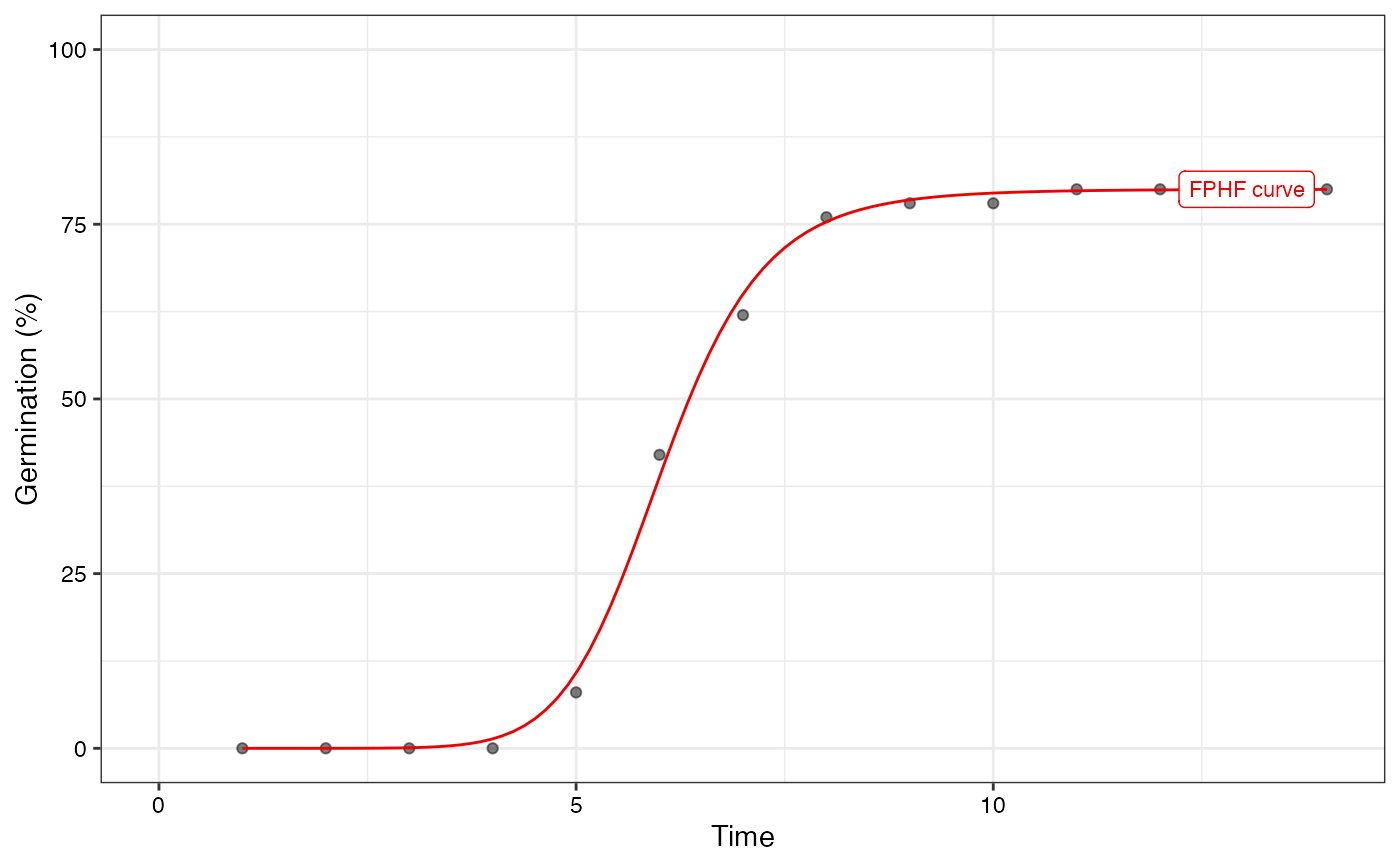
 # Only the FPHF curve
plot(fit1, rog = FALSE, t50.total = FALSE, t50.germ = FALSE,
tmgr = FALSE, mgt = FALSE, uniformity = FALSE)
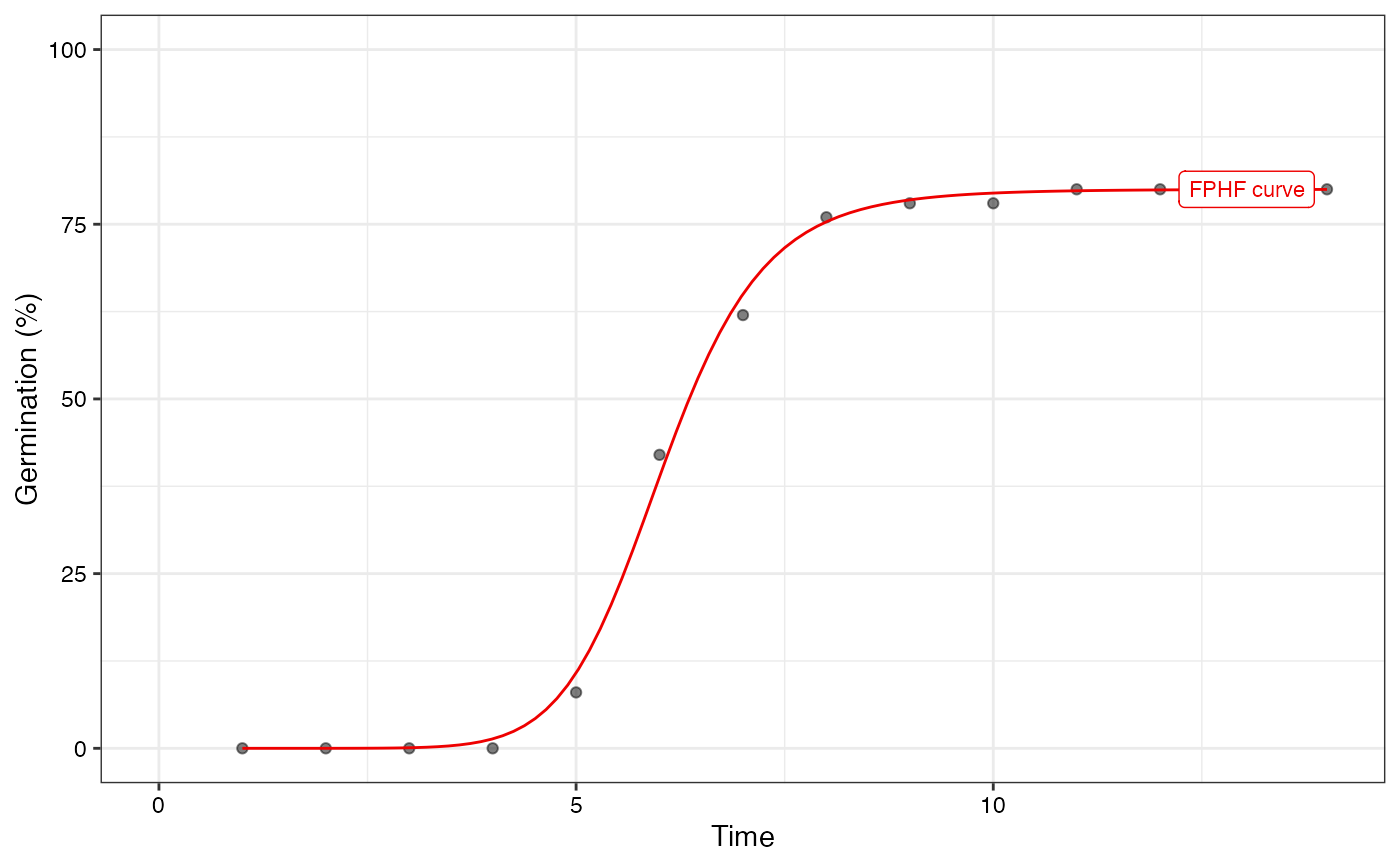
 plot(fit2, rog = FALSE, t50.total = FALSE, t50.germ = FALSE,
tmgr = FALSE, mgt = FALSE, uniformity = FALSE)
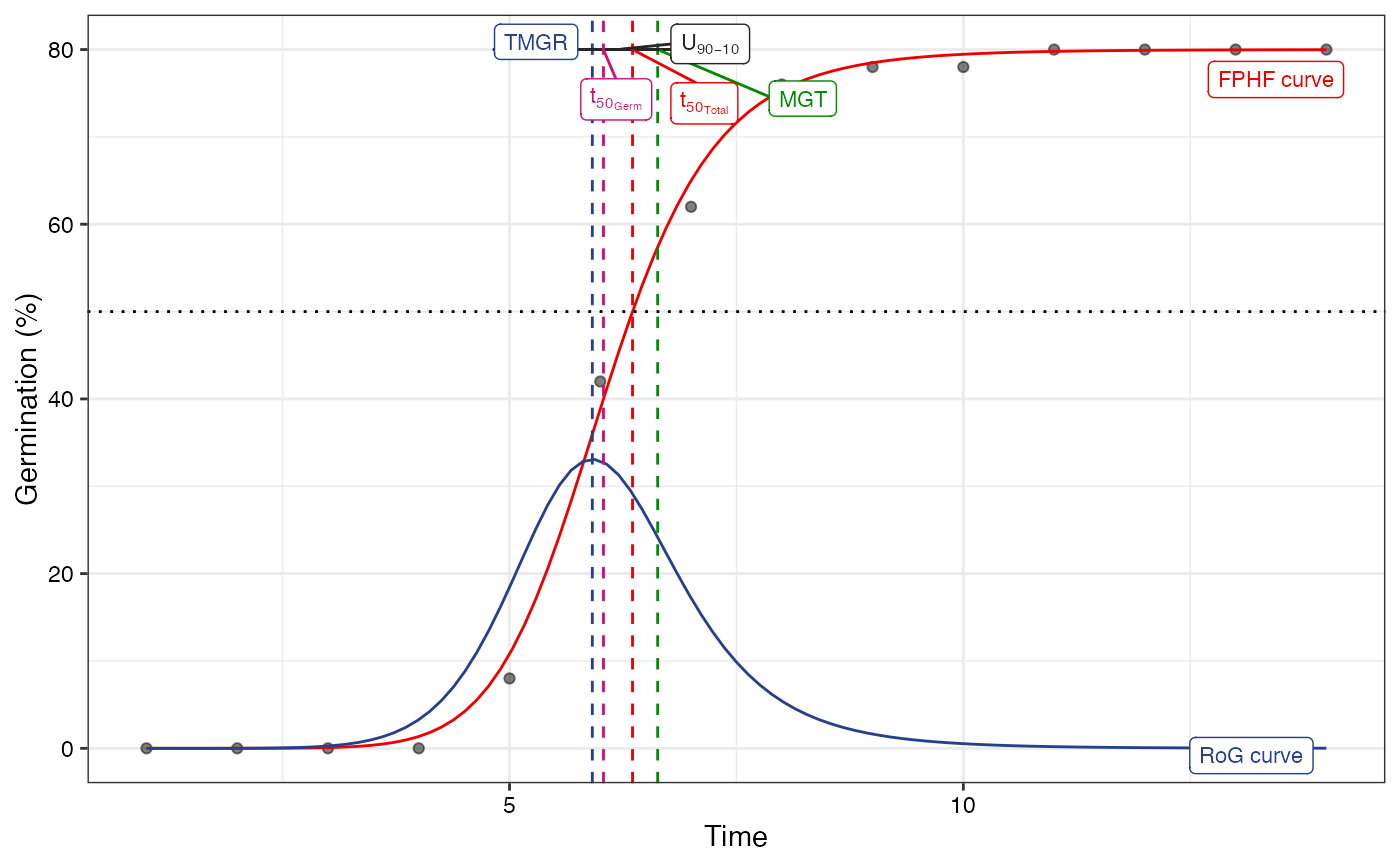
 # Without y axis limits adjustment
plot(fit1, limits = FALSE)
#> Warning: All aesthetics have length 1, but the data has 14 rows.
#> ℹ Please consider using `annotate()` or provide this layer with data containing
#> a single row.
#> Warning: All aesthetics have length 1, but the data has 14 rows.
#> ℹ Please consider using `annotate()` or provide this layer with data containing
#> a single row.
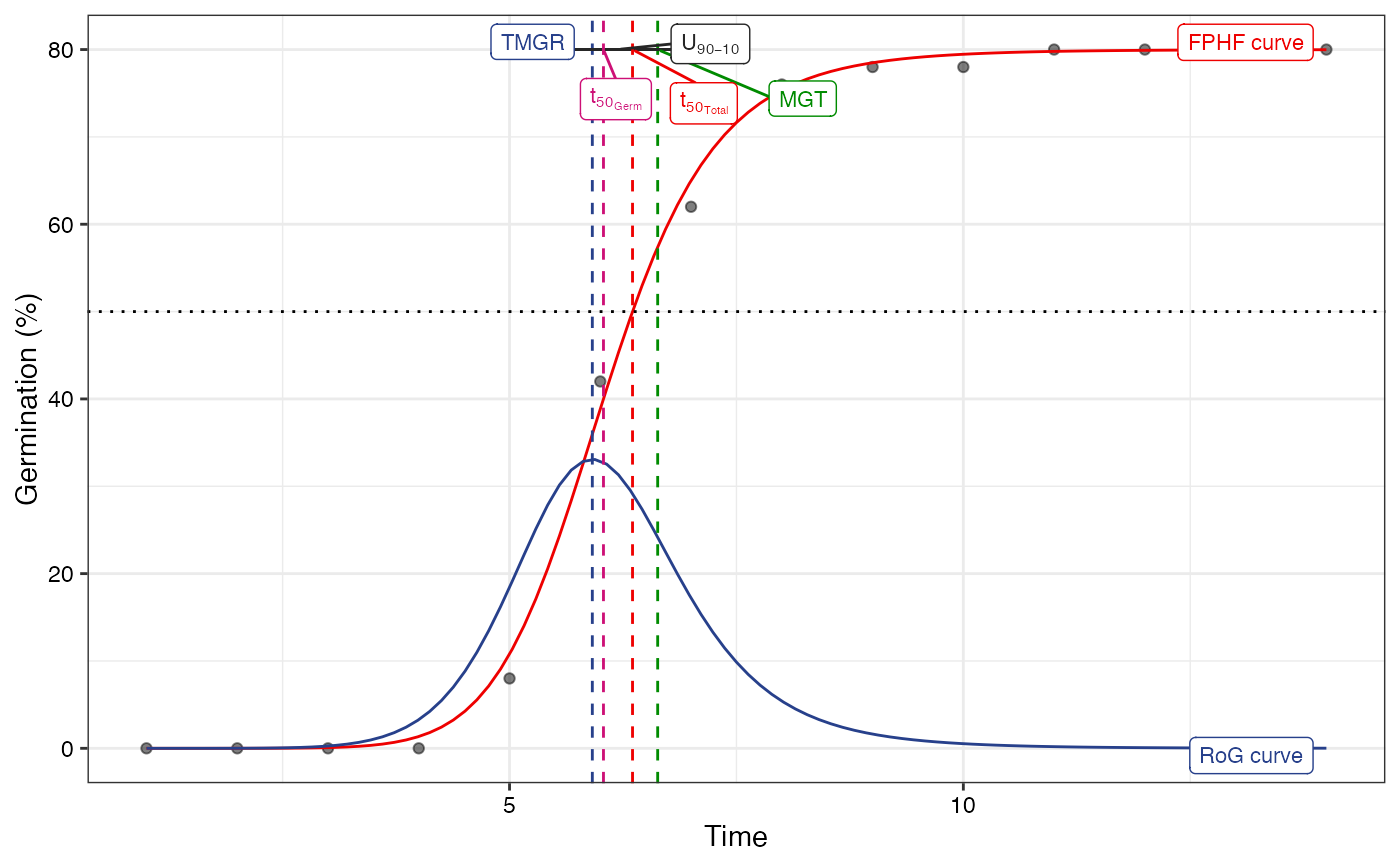
 plot(fit2, limits = FALSE)
#> Warning: All aesthetics have length 1, but the data has 14 rows.
#> ℹ Please consider using `annotate()` or provide this layer with data containing
#> a single row.
#> Warning: All aesthetics have length 1, but the data has 14 rows.
#> ℹ Please consider using `annotate()` or provide this layer with data containing
#> a single row.
 # }
# }