The `germinationmetrics` Package: A Brief Introduction
Aravind, J., Vimala Devi, S., Radhamani, J., Jacob, S. R., and Kalyani Srinivasan
2026-04-29
Source:vignettes/Introduction.Rmd
Introduction.RmdICAR-National Bureau of Plant Genetic Resources, New Delhi.

Overview
The package germinationmetrics is a collection of
functions which implements various methods for describing the
time-course of germination in terms of single-value germination indices
as well as fitted curves.
The goal of this vignette is to introduce the users to these
functions and get started in describing sequentially recorded
germination count data. This document assumes a basic knowledge of
R programming language.
Installation
The package can be installed using the following functions:
# Install from CRAN
install.packages('germinationmetrics', dependencies=TRUE)

# Install development version from Github
devtools::install_github("aravind-j/germinationmetrics")
Then the package can be loaded using the function
--------------------------------------------------------------------------------
Welcome to germinationmetrics version 0.1.10.9000


# To know how to use this package type:
  browseVignettes(package = 'germinationmetrics')
  for the package vignette.

# To know whats new in this version type:
  news(package='germinationmetrics')
  for the NEWS file.

# To cite the methods in the package type:
  citation(package='germinationmetrics')

# To suppress this message use:
  suppressPackageStartupMessages(library(germinationmetrics))
--------------------------------------------------------------------------------
Version History
The current version of the package is 0.1.10. The previous versions are as follows.
Table 1. Version history of
germinationmetrics R package.
| Version | Date |
|---|---|
| 0.1.0 | 2018-04-17 |
| 0.1.1 | 2018-07-26 |
| 0.1.1.1 | 2018-10-16 |
| 0.1.2 | 2018-10-31 |
| 0.1.3 | 2019-01-19 |
| 0.1.4 | 2020-06-16 |
| 0.1.5 | 2021-02-17 |
| 0.1.6 | 2022-06-15 |
| 0.1.7 | 2022-08-28 |
| 0.1.8 | 2023-08-18 |
| 0.1.9 | 2025-12-14 |
To know detailed history of changes use
news(package='germinationmetrics').
Germination count data
Typically in a germination test, the germination count data of a fixed number of seeds is recorded at regular intervals for a definite period of time or until all the seeds have germinated. These germination count data can be either partial or cumulative (Table 2).
Table 2 : A typical germination count data.
| intervals | counts | cumulative.counts |
|---|---|---|
| 1 | 0 | 0 |
| 2 | 0 | 0 |
| 3 | 0 | 0 |
| 4 | 0 | 0 |
| 5 | 4 | 4 |
| 6 | 17 | 21 |
| 7 | 10 | 31 |
| 8 | 7 | 38 |
| 9 | 1 | 39 |
| 10 | 0 | 39 |
| 11 | 1 | 40 |
| 12 | 0 | 40 |
| 13 | 0 | 40 |
| 14 | 0 | 40 |
The time-course of germination can be plotted as follows.
data <- data.frame(intervals = 1:14,
                   counts = c(0, 0, 0, 0, 4, 17, 10, 7, 1, 0, 1, 0, 0, 0))

# Partial germination counts
x <- data$counts
# Cumulative germination counts
y <- cumsum(x)
# Time intervals of observations
int <- data$intervals

plot(int, cumsum(x))
Single-value germination indices
The details about the single-value germination indices implemented in
germinationmetrics are described in Table 3.
Table 3 : Single-value germination indices
implemented in germinationmetrics.
| Germination index | Function | Details | Unit | Measures | Reference |
|---|---|---|---|---|---|
| Germination percentage or Final germination percentage or Germinability (\(GP\)) | GermPercent |
It is computed as follows. \[GP = \frac{N_{g}}{N_{t}} \times 100\] Where, \(N_{g}\) is the number of germinated seeds and \(N_{t}\) is the total number of seeds. |
Percentage (%) | Germination capacity | ISTA (2015) |
| Peak germination percentage (\(PGP\)) | PeakGermPercent |
It is computed as follows. \[PGP = \frac{N_{max}}{N_{t}} \times 100\] Where, \(N_{max}\) is the maximum number of seeds germinated per interval. |
Percentage (%) | Germination capacity | Vallance (1950); Roh et al. (2004) |
| Time for the first germination or Germination time lag (\(t_{0}\)) | FirstGermTime |
It is the time for first germination to occur (e.g. First day of
germination). \[t_{0} = \min \left\{ T_{i} : N_{i} \neq 0 \right\}\] Where, \(T_{i}\) is the time from the start of the experiment to the \(i\)th interval and \(N_{i}\) is the number of seeds germinated in the \(i\)th time interval (not the accumulated number, but the number corresponding to the \(i\)th interval) |
time | Germination time | Edwards (1932); Czabator (1962); Goloff and Bazzaz (1975); Labouriau (1983a); Ranal (1999); Quintanilla et al. (2000) |
| Time for the last germination (\(t_{g}\)) | LastGermTime |
It is the time for last germination to occur (e.g. Last day of
germination) \[t_{g} = \max \left\{ T_{i} : N_{i} \neq 0 \right\}\] Where, \(T_{i}\) is the time from the start of the experiment to the \(i\)th interval and \(N_{i}\) is the number of seeds germinated in the \(i\)th time interval (not the accumulated number, but the number corresponding to the \(i\)th interval) |
time | Germination time | Edwards (1932) |
| Time spread of germination or Germination distribution | TimeSpreadGerm |
It is the difference between time for last germination (\(t_{g}\)) and time for first germination
(\(t_{0}\)). \[Time\,spread\,of\, germination = t_{g}-t_{0}\] |
time | Germination time | Al-Mudaris (1998); Schrader and Graves (2000); Kader (2005) |
| Peak period of germination or Modal time of germination (\(t_{peak}\)) | PeakGermTime |
It is the time in which highest frequency of germinated seeds are
observed and need not be unique. \[t_{peak} = \left\{ T_{i} : N_{i} = N_{max} \right\}\] Where, \(T_{i}\) is the time from the start of the experiment to the \(i\)th interval, \(N_{i}\) is the number of seeds germinated in the \(i\)th time interval (not the accumulated number, but the number corresponding to the \(i\)th interval) and \(N_{max}\) is the maximum number of seeds germinated per interval. |
time | Germination time | Ranal and Santana (2006) |
| Median germination time (\(t_{50}\)) (Coolbear) | t50 |
It is the time to reach 50% of final/maximum germination. With argument method specified as "coolbear",
it is computed as follows.\[t_{50}=T_{i}+\frac{(\frac{N+1}{2}-N_{i})(T_{j}-T_{i})}{N_{j}-N_{i}}\] Where, \(t_{50}\) is the median germination time, \(N\) is the final number of germinated seeds, and \(N_{i}\) and \(N_{j}\) are the total number of seeds germinated in adjacent counts at time \(T_{i}\) and \(T_{j}\) respectively, when \(N_{i} < \frac{N + 1}{2} < N_{j}\). |
time | Germination time | Coolbear et al. (1984) |
| Median germination time (\(t_{50}\)) (Farooq) | t50 |
With argument method specified as
"farooq", it is computed as follows.\[t_{50}=T_{i}+\frac{(\frac{N}{2}-N_{i})(T_{j}-T_{i})}{N_{j}-N_{i}}\] Where, \(t_{50}\) is the median germination time, \(N\) is the final number of germinated seeds, and \(N_{i}\) and \(N_{j}\) are the total number of seeds germinated in adjacent counts at time \(T_{i}\) and \(T_{j}\) respectively, when \(N_{i} < \frac{N}{2} < N_{j}\). |
time | Germination time | Farooq et al. (2005) |
| Mean germination time or Mean length of incubation time (\(\overline{T}\)) or Germination resistance (\(GR\)) or Sprouting index (\(SI\)) or Emergence index (\(EI\)) | MeanGermTime |
It is the average length of time required for maximum germination of
a seed lot and is estimated according to the following formula. \[\overline{T} = \frac{\sum_{i=1}^{k}N_{i}T_{i}}{\sum_{i=1}^{k}N_{i}}\] Where, \(T_{i}\) is the time from the start of the experiment to the \(i\)th interval, \(N_{i}\) is the number of seeds germinated in the \(i\)th time interval (not the accumulated number, but the number corresponding to the \(i\)th interval), and \(k\) is the total number of time intervals. It is the inverse of mean germination rate (\(\overline{V}\)). \[\overline{T} = \frac{1}{\overline{V}}\] |
time | Germination time | Edmond and Drapala (1958); Czabator (1962); Smith and Millet (1964); Gordon (1969); Gordon (1971); Mock and Eberhart (1972); Ellis and Roberts (1980) Labouriau (1983a); Ranal and Santana (2006) |
| Variance of germination time (\(s_{T}^{2}\)) | VarGermTime |
It is computed according to the following formula. \[s_{T}^{2} = \frac{\sum_{i=1}^{k}N_{i}(T_{i}-\overline{T})^{2}}{\sum_{i=1}^{k}N_{i}-1}\] Where, \(T_{i}\) is the time from the start of the experiment to the \(i\)th interval, \(N_{i}\) is the number of seeds germinated in the \(i\)th time interval (not the accumulated number, but the number corresponding to the \(i\)th interval), and \(k\) is the total number of time intervals. |
time-1 | Germination time | Labouriau (1983a); Ranal and Santana (2006) |
| Standard error of germination time (\(s_{\overline{T}}\)) | SEGermTime |
It signifies the accuracy of the calculation of the mean germination
time. It is estimated according to the following formula: \[s_{\overline{T}} = \sqrt{\frac{s_{T}^{2}}{\sum_{i=1}^{k}N_{i}}}\] Where, \(N_{i}\) is the number of seeds germinated in the \(i\)th time interval (not the accumulated number, but the number corresponding to the \(i\)th interval) and \(k\) is the total number of time intervals. |
time | Germination time | Labouriau (1983a); Ranal and Santana (2006) |
| Mean germination rate (\(\overline{V}\)) | MeanGermRate |
It is computed according to the following formula: \[\overline{V} = \frac{\sum_{i=1}^{k}N_{i}}{\sum_{i=1}^{k}N_{i}T_{i}}\] Where, \(T_{i}\) is the time from the start of the experiment to the \(i\)th interval, \(N_{i}\) is the number of seeds germinated in the \(i\)th time interval (not the accumulated number, but the number corresponding to the \(i\)th interval), and \(k\) is the total number of time intervals. It is the inverse of mean germination time (\(\overline{T}\)). \[\overline{V} = \frac{1}{\overline{T}}\] |
time-1 | Germination rate | Labouriau and Valadares (1976); Labouriau (1983b); Ranal and Santana (2006) |
| Coefficient of velocity of germination (\(CVG\)) or Coefficient of rate of germination (\(CRG\)) or Kotowski’s coefficient of velocity | CVG |
It is estimated according to the following formula. \[CVG = \frac{\sum_{i=1}^{k}N_{i}}{\sum_{i=1}^{k}N_{i}T_{i}} \times 100\] \[CVG = \overline{V} \times 100\] Where, \(T_{i}\) is the time from the start of the experiment to the \(i\)th interval, \(N_{i}\) is the number of seeds germinated in the \(i\)th time interval (not the accumulated number, but the number corresponding to the \(i\)th interval), and \(k\) is the total number of time intervals. |
% time-1 | Germination rate | Kotowski (1926), Nichols and Heydecker (1968); Bewley and Black (1994); Labouriau (1983b); Scott et al. (1984) |
| Variance of germination rate (\(s_{V}^{2}\)) | VarGermRate |
It is calculated according to the following formula. \[s_{V}^{2} = \overline{V}^{4} \times s_{T}^{2}\] Where, \(s_{T}^{2}\) is the variance of germination time. |
time-2 | Germination rate | Labouriau (1983b); Ranal and Santana (2006) |
| Standard error of germination rate (\(s_{\overline{V}}\)) | SEGermRate |
It is estimated according to the following formula. \[s_{\overline{V}} = \sqrt{\frac{s_{V}^{2}}{\sum_{i=1}^{k}N_{i}}}\] Where, \(N_{i}\) is the number of seeds germinated in the \(i\)th time interval (not the accumulated number, but the number corresponding to the \(i\)th interval), and \(k\) is the total number of time intervals. |
time-1 | Germination rate | Labouriau (1983b); Ranal and Santana (2006) |
| Germination rate as the reciprocal of the median time (\(v_{50}\)) | GermRateRecip |
It is the reciprocal of the median germination time (\(t_{50}\)). \[v_{50} = \frac{1}{t_{50}}\] |
time-1 | Germination rate | Went (1957); Labouriau (1983b); Ranal and Santana (2006) |
| Speed of germination (\(S\)) or Germination rate Index or index of velocity of germination or Emergence rate index (Allan, Vogel and Peterson; Erbach; Hsu and Nelson) or Germination index (AOSA) | GermSpeed |
It is the rate of germination in terms of the total number of seeds
that germinate in a time interval. It is estimated as follows. \[S = \sum_{i=1}^{k}\frac{N_{i}}{T_{i}}\] Where, \(T_{i}\) is the time from the start of the experiment to the \(i\)th interval, \(N_{i}\) is the number of seeds germinated in the \(i\)th time interval (not the accumulated number, but the number corresponding to the \(i\)th interval), and \(k\) is the total number of time intervals. Instead of germination counts, germination percentages may also be used for computation of speed of germination. |
% time-1 or count time-1 | Mixed | Throneberry and Smith (1955); Maguire (1962); Allan et al. (1962); Kendrick and Frankland (1969); Bouton et al. (1976); Erbach (1982); AOSA (1983); Khandakar and Bradbeer (1983); Hsu and Nelson (1986); Bradbeer (1988); Wardle et al. (1991) |
| Speed of accumulated germination (\(S_{accumulated}\)) | GermSpeedAccumulated |
It is the rate of germination in terms of the accumulated/cumulative
total number of seeds that germinate in a time interval. It is estimated as follows. \[S_{accumulated} = \sum_{i=1}^{k}\frac{\sum_{j=1}^{i}N_{j}}{T_{i}}\] Where, \(T_{i}\) is the time from the start of the experiment to the \(i\)th interval, \(\sum_{j=1}^{i}N_{j}\) is the cumuative/accumulated number of seeds germinated in the \(i\)th interval, and \(k\) is the total number of time intervals. Instead of germination counts, germination percentages may also be used for computation of speed of germination. |
% time-1 or count time-1 | Mixed | Bradbeer (1988); Wardle et al. (1991); Haugland and Brandsaeter (1996); Santana and Ranal (2004) |
| Corrected speed of germination or Corrected germination rate index (\(\hat{S}\)) | GermSpeedCorrected |
It is computed as follows. \[S_{corrected} = \frac{S}{FGP}\] Where, \(S\) is the germination speed computed with germination percentage instead of counts and \(FGP\) is the final germination percentage or germinability. It can also be computed from speed of accumulated germination (computed with germination percentage). \[\hat{S}_{accumulated} = \frac{S_{accumulated}}{FGP}\] Where, \(S_{accumulated}\) is the speed of accumulated germination computed with germination percentage instead of counts and \(FGP\) is the final germination percentage or germinability. |
time-1 | Mixed | Evetts and Burnside (1972) |
| Weighted germination percentage (\(WGP\)) | WeightGermPercent |
It is estimated as follows. \[WGP = \frac{\sum_{i=1}^{k}(k-i+1)N_{i}}{k \times N} \times 100\] Where, \(N_{i}\) is the number of seeds that germinated in the time interval \(i\) (not cumulative, but partial count), \(N\) is the total number of seeds tested, and \(k\) is the total number of time intervals. |
Percentage (%) | Mixed | Reddy et al. (1985); Reddy (1978) |
| Mean germination percentage per unit time (\(\overline{GP}\)) | MeanGermPercent |
It is estimated as follows. \[\overline{GP} = \frac{GP}{T_{k}}\] Where, \(GP\) is the final germination percentage, \(T_{k}\) is the time at the \(k\)th time interval, and \(k\) is the total number of time intervals required for final germination. |
% time-1 | Mixed | Czabator (1962) |
| Number of seeds germinated per unit time \(\overline{N}\) | MeanGermNumber |
It is estimated as follows. \[\overline{N} = \frac{N_{g}}{T_{k}}\] Where, \(N_{g}\) is the number of germinated seeds at the end of the germination test, \(T_{k}\) is the time at the \(k\)th time interval, and \(k\) is the total number of time intervals required for final germination. |
count time-1 | Mixed | Khamassi et al. (2013) |
| Timson’s index [\(\sum 10\) (Ten summation), \(\sum 5\) or \(\sum 20\)] or Germination energy index (\(GEI\)) | TimsonsIndex |
It is the progressive total of cumulative germination percentage
recorded at specific intervals for a set period of time and is estimated
in terms of cumulative germination percentage (\(G_{i}\)) as follows. \[\Sigma k = \sum_{i=1}^{k}G_{i}\] Where, \(G_{i}\) is the cumulative germination percentage in time interval \(i\), and \(k\) is the total number of time intervals. It also estimated in terms of partial germination percentage as follows. \[\Sigma k = \sum_{i=1}^{k}g_{i}(k-j)\] Where, \(g_{i}\) is the germination (not cumulative, but partial germination) in time interval \(i\) (\(i\) varying from \(0\) to \(k\)), \(k\) is the total number of time intervals, and \(j = i - 1\). |
Percentage (%) | Mixed | Grose and Zimmer (1958); Timson (1965); Lyon and Coffelt (1966); Chaudhary and Ghildyal (1970); Negm and Smith (1978); Brown and Mayer (1988); Baskin and Baskin (1998); Goodchild and Walker (1971) |
| Modified Timson’s index (\(\Sigma k_{mod}\)) (Labouriau) | TimsonsIndex |
It is estimated as Timson’s index \(\Sigma
k\) divided by the sum of partial germination percentages. \[\Sigma k_{mod} = \frac{\Sigma k}{\sum_{i=1}^{k}g_{i}}\] |
no unit | Mixed | Ranal and Santana (2006) |
| Modified Timson’s index (\(\Sigma k_{mod}\)) (Khan and Unger) | TimsonsIndex |
It is estimated as Timson’s index (\(\Sigma k\)) divided by the total time
period of germination (\(T_{k}\)). \[\Sigma k_{mod} = \frac{\Sigma k}{T_{k}}\] |
% time-1 | Mixed | Khan and Ungar (1984) |
| George’s index (\(GR\)) | GermRateGeorge |
It is estimated as follows. \[GR = \sum_{i=1}^{k}N_{i}K_{i}\] Where \(N_{i}\) is the number of seeds germinated by \(i\)th interval and \(K_{i}\) is the number of intervals(eg. days) until the end of the test, and and \(k\) is the total number of time intervals. |
count time | Mixed | George (1961); Tucker and Wright (1965); Nichols and Heydecker (1968);Chopra and Chaudhary (1980) |
| Germination Index (\(GI\)) (Melville) | GermIndex |
It is estimated as follows. \[GI = \sum_{i=1}^{k}\frac{\left | \left ( T_{k} - T_{i} \right ) N_{i}\right |}{N_{t}}\] Where, \(T_{i}\) is the time from the start of the experiment to the \(i\)th interval (day for the example), \(N_{i}\) is the number of seeds germinated in the \(i\)th time interval (not the accumulated number, but the number corresponding to the \(i\)th interval), \(N_{t}\) is the total number of seeds used in the test, and \(k\) is the total number of time intervals. |
time | Mixed | Melville et al. (1980) |
| Germination Index (\(GI_{mod}\)) (Melville; Santana and Ranal) | GermIndex |
It is estimated as follows. \[GI_{mod} = \sum_{i=1}^{k}\frac{\left | \left ( T_{k} - T_{i} \right ) N_{i}\right |}{N_{g}}\] Where, \(T_{i}\) is the time from the start of the experiment to the \(i\)th interval (day for the example), \(N_{i}\) is the number of seeds germinated in the \(i\)th time interval (not the accumulated number, but the number corresponding to the \(i\)th interval), \(N_{g}\) is the total number of germinated seeds at the end of the test, and \(k\) is the total number of time intervals. |
time | Mixed | Melville et al. (1980); Santana and Ranal (2004); Ranal and Santana (2006) |
| Emergence Rate Index (\(ERI\)) or Germination Rate Index (Shmueli and Goldberg) | EmergenceRateIndex |
It is estimated as follows. \[ERI = \sum_{i=i_{0}}^{k-1}N_{i}(k-i)\] Where, \(N_{i}\) is the number of seeds germinated in the \(i\)th time interval (not the accumulated number, but the number corresponding to the \(i\)th interval), \(i_{0}\) is the time interval when emergence/germination started, and \(k\) is the total number of time intervals. |
count | Mixed | Shmueli and Goldberg (1971) |
| Modified Emergence Rate Index (\(ERI_{mod}\)) or Modified Germination Rate Index (Shmueli and Goldberg; Santana and Ranal) | EmergenceRateIndex |
It is estimated by dividing Emergence rate index (\(ERI\)) by total number of emerged seedlings
(or germinated seeds). \[ERI_{mod} = \frac{\sum_{i=i_{0}}^{k-1}N_{i}(k-i)}{N_{g}} = \frac{ERI}{N_{g}}\] Where, \(N_{g}\) is the total number of germinated seeds at the end of the test, \(N_{i}\) is the number of seeds germinated in the \(i\)th time interval (not the accumulated number, but the number corresponding to the \(i\)th interval), \(i_{0}\) is the time interval when emergence/germination started, and \(k\) is the total number of time intervals. |
no unit | Mixed | Shmueli and Goldberg (1971); Santana and Ranal (2004); Ranal and Santana (2006) |
| Emergence Rate Index (\(ERI\)) or Germination Rate Index (Bilbro & Wanjura) | EmergenceRateIndex |
It is the estimated as follows. \[ERI = \frac{\sum_{i=1}^{k}N_{i}}{\overline{T}} = \frac{N_{g}}{\overline{T}}\] Where, \(N_{g}\) is the total number of germinated seeds at the end of the test, \(N_{i}\) is the number of seeds germinated in the \(i\)th time interval (not the accumulated number, but the number corresponding to the \(i\)th interval), and \(\overline{T}\) is the mean germination time or mean emergence time. |
count time-1 | Mixed | Bilbro and Wanjura (1982) |
| Emergence Rate Index (\(ERI\)) or Germination Rate Index (Fakorede) | EmergenceRateIndex |
It is estimated as follows. \[ERI = \frac{\overline{T}}{FGP/100}\] Where, \(\overline{T}\) is the Mean germination time and \(FGP\) is the final germination time. |
time count-1 | Mixed | Fakorede and Ayoola (1980); Fakorede and Ojo (1981); Fakorede and Agbana (1983) |
| Peak value(\(PV\)) (Czabator) or Emergence Energy (\(EE\)) | PeakValue |
It is the accumulated number of seeds germinated at the point on the
germination curve at which the rate of germination starts to decrease.
It is computed as the maximum quotient obtained by dividing successive
cumulative germination values by the relevant incubation time. \[PV = \max\left ( \frac{G_{1}}{T_{1}},\frac{G_{2}}{T_{2}},\cdots \frac{G_{k}}{T_{k}} \right )\] Where, \(T_{i}\) is the time from the start of the experiment to the \(i\)th interval, \(G_{i}\) is the cumulative germination percentage in the \(i\)th time interval, and \(k\) is the total number of time intervals. |
% time-1 | Mixed | Czabator (1962); Bonner (1967) |
| Germination value (\(GV\)) (Czabator) | GermValue |
It is computed as follows. \[GV = PV \times MDG\] Where, \(PV\) is the peak value and \(MDG\) is the mean daily germination percentage from the onset of germination. It can also be computed for other time intervals of successive germination counts, by replacing \(MDG\) with the mean germination percentage per unit time (\(\overline{GP}\)). \(GV\) value can be modified (\(GV_{mod}\)), to consider the entire duration from the beginning of the test instead of just from the onset of germination. |
%2 time-2 | Mixed | Czabator (1962); Brown and Mayer (1988) |
| Germination value (\(GV\)) (Diavanshir and Pourbiek) | GermValue |
It is computed as follows. \[GV = \frac{\sum DGS}{N} \times GP \times c\] Where, \(DGS\) is the daily germination speed computed by dividing cumulative germination percentage by the number of days since the since the onset of germination, \(N\) is the frequency or number of DGS calculated during the test, \(GP\) is the germination percentage expressed over 100, and \(c\) is a constant. The value of \(c\) is decided on the basis of average daily speed of germination (\(\frac{\sum DGS}{N}\)). If it is less than 10, then \(c\) value of 10 can be used and if it is more than 10, then value of 7 or 8 can be used for \(c\). \(GV\) value can be modified (\(GV_{mod}\)), to consider the entire duration from the beginning of the test instead of just from the onset of germination. |
%2 time-1 | Mixed | Djavanshir and Pourbeik (1976); Brown and Mayer (1988) |
| Coefficient of uniformity of germination (\(CUG\)) | CUGerm |
It is computed as follows. \[CUG = \frac{\sum_{i=1}^{k}N_{i}}{\sum_{i=1}^{k}(\overline{T}-T_{i})^{2}N_{i}}\] Where, \(\overline{T}\) is the the mean germination time, \(T_{i}\) is the time from the start of the experiment to the \(i\)th interval (day for the example), \(N_{i}\) is the number of seeds germinated in the \(i\)th time interval (not the accumulated number, but the number corresponding to the \(i\)th interval), and \(k\) is the total number of time intervals. |
time-2 | Germination unifromity | Heydecker (1972); Bewley and Black (1994) |
| Coefficient of variation of the germination time (\(CV_{T}\)) | CVGermTime |
It is estimated as follows. \[CV_{T} = \sqrt{\frac{s_{T}^{2}}{\overline{T}}}\] Where, \(s_{T}^{2}\) is the variance of germination time and \(\overline{T}\) is the mean germination time. |
no unit | Germination unifromity | Gomes (1960); Ranal and Santana (2006) |
| Synchronization index (\(\overline{E}\)) or Uncertainty of the germination process (\(U\)) or informational entropy (\(H\)) | GermUncertainty |
It is estimated as follows. \[\overline{E} = -\sum_{i=1}^{k}f_{i}\log_{2}f_{i}\] Where, \(f_{i}\) is the relative frequency of germination (\(f_{i}=\frac{N_{i}}{\sum_{i=1}^{k}N_{i}}\)), \(N_{i}\) is the number of seeds germinated on the \(i\)th time interval, and \(k\) is the total number of time intervals. |
bit | Germination synchrony | Shannon (1948); Labouriau and Valadares (1976); Labouriau (1983b) |
| Synchrony of germination (\(Z\) index) | GermSynchrony |
It is computed as follows. \[Z=\frac{\sum_{i=1}^{k}C_{N_{i},2}}{C_{\Sigma N_{i},2}}\] Where, \(C_{N_{i},2}\) is the partial combination of the two germinated seeds from among \(N_{i}\), the number of seeds germinated on the \(i\)th time interval (estimated as \(C_{N_{i},2}=\frac{N_{i}(N_{i}-1)}{2}\)), and \(C_{\Sigma N_{i},2}\) is the partial combination of the two germinated seeds from among the total number of seeds germinated at the final count, assuming that all seeds that germinated did so simultaneously. |
no unit | Germination synchrony | Primack (1985); Ranal and Santana (2006) |
GermPercent()
x <- c(0, 0, 0, 0, 4, 17, 10, 7, 1, 0, 1, 0, 0, 0)
y <- c(0, 0, 0, 0, 4, 21, 31, 38, 39, 39, 40, 40, 40, 40)
z <- c(0, 0, 0, 0, 11, 11, 9, 7, 1, 0, 1, 0, 0, 0)
int <- 1:length(x)

# From partial germination counts
#----------------------------------------------------------------------------
GermPercent(germ.counts = x, total.seeds = 50)
[1] 80
PeakGermPercent(germ.counts = x, intervals = int, total.seeds = 50)[1] 34
# For multiple peak germination times
PeakGermPercent(germ.counts = z, intervals = int, total.seeds = 50)
Warning in PeakGermPercent(germ.counts = z, intervals = int, total.seeds = 50):
Multiple peak germination times exist.[1] 22
# From cumulative germination counts
#----------------------------------------------------------------------------
GermPercent(germ.counts = y, total.seeds = 50, partial = FALSE)
[1] 80
PeakGermPercent(germ.counts = y, intervals = int, total.seeds = 50,
                partial = FALSE)
[1] 34
# For multiple peak germination times
PeakGermPercent(germ.counts = cumsum(z), intervals = int, total.seeds = 50,
                partial = FALSE)
Warning in PeakGermPercent(germ.counts = cumsum(z), intervals = int,
total.seeds = 50, : Multiple peak germination times exist.[1] 22
# From number of germinated seeds
#----------------------------------------------------------------------------
GermPercent(germinated.seeds = 40, total.seeds = 50)
[1] 80
FirstGermTime(), LastGermTime(), PeakGermTime(), TimeSpreadGerm()
x <- c(0, 0, 0, 0, 4, 17, 10, 7, 1, 0, 1, 0, 0, 0)
y <- c(0, 0, 0, 0, 4, 21, 31, 38, 39, 39, 40, 40, 40, 40)
z <- c(0, 0, 0, 0, 11, 11, 9, 7, 1, 0, 1, 0, 0, 0)
int <- 1:length(x)

# From partial germination counts
#----------------------------------------------------------------------------
FirstGermTime(germ.counts = x, intervals = int)
[1] 5
LastGermTime(germ.counts = x, intervals = int)[1] 11
TimeSpreadGerm(germ.counts = x, intervals = int)[1] 6
PeakGermTime(germ.counts = x, intervals = int)[1] 6
# For multiple peak germination times
PeakGermTime(germ.counts = z, intervals = int)
Warning in PeakGermTime(germ.counts = z, intervals = int): Multiple peak
germination times exist.[1] 5 6
# From cumulative germination counts
#----------------------------------------------------------------------------
FirstGermTime(germ.counts = y, intervals = int, partial = FALSE)
[1] 5
LastGermTime(germ.counts = y, intervals = int, partial = FALSE)[1] 11
TimeSpreadGerm(germ.counts = y, intervals = int, partial = FALSE)[1] 6
PeakGermTime(germ.counts = y, intervals = int, partial = FALSE)[1] 6
# For multiple peak germination time
PeakGermTime(germ.counts = cumsum(z), intervals = int, partial = FALSE)
Warning in PeakGermTime(germ.counts = cumsum(z), intervals = int, partial =
FALSE): Multiple peak germination times exist.[1] 5 6
t50()
x <- c(0, 0, 0, 0, 4, 17, 10, 7, 1, 0, 1, 0, 0, 0)
y <- c(0, 0, 0, 0, 4, 21, 31, 38, 39, 39, 40, 40, 40, 40)
int <- 1:length(x)

# From partial germination counts
#----------------------------------------------------------------------------
t50(germ.counts = x, intervals = int, method = "coolbear")
[1] 5.970588
t50(germ.counts = x, intervals = int, method = "farooq")[1] 5.941176
# From cumulative germination counts
#----------------------------------------------------------------------------
t50(germ.counts = y, intervals = int, partial = FALSE, method = "coolbear")
[1] 5.970588
t50(germ.counts = y, intervals = int, partial = FALSE, method = "farooq")[1] 5.941176
MeanGermTime(), VarGermTime(), SEGermTime(), CVGermTime()
x <- c(0, 0, 0, 0, 4, 17, 10, 7, 1, 0, 1, 0, 0, 0)
y <- c(0, 0, 0, 0, 4, 21, 31, 38, 39, 39, 40, 40, 40, 40)
int <- 1:length(x)

# From partial germination counts
#----------------------------------------------------------------------------
MeanGermTime(germ.counts = x, intervals = int)
[1] 6.7
VarGermTime(germ.counts = x, intervals = int)[1] 1.446154
SEGermTime(germ.counts = x, intervals = int)[1] 0.1901416
CVGermTime(germ.counts = x, intervals = int)[1] 0.1794868
# From cumulative germination counts
#----------------------------------------------------------------------------
MeanGermTime(germ.counts = y, intervals = int, partial = FALSE)
[1] 6.7
VarGermTime(germ.counts = y, intervals = int, partial = FALSE)[1] 1.446154
SEGermTime(germ.counts = y, intervals = int, partial = FALSE)[1] 0.1901416
CVGermTime(germ.counts = y, intervals = int, partial = FALSE)[1] 0.1794868
MeanGermRate(), CVG(), VarGermRate(), SEGermRate(), GermRateRecip()
x <- c(0, 0, 0, 0, 4, 17, 10, 7, 1, 0, 1, 0, 0, 0)
y <- c(0, 0, 0, 0, 4, 21, 31, 38, 39, 39, 40, 40, 40, 40)
int <- 1:length(x)

# From partial germination counts
#----------------------------------------------------------------------------
MeanGermRate(germ.counts = x, intervals = int)
[1] 0.1492537
CVG(germ.counts = x, intervals = int)[1] 14.92537
VarGermRate(germ.counts = x, intervals = int)[1] 0.0007176543
SEGermRate(germ.counts = x, intervals = int)[1] 0.004235724
GermRateRecip(germ.counts = x, intervals = int, method = "coolbear")[1] 0.1674877
GermRateRecip(germ.counts = x, intervals = int, method = "farooq")[1] 0.1683168
# From cumulative germination counts
#----------------------------------------------------------------------------
MeanGermRate(germ.counts = y, intervals = int, partial = FALSE)
[1] 0.1492537
CVG(germ.counts = y, intervals = int, partial = FALSE)[1] 14.92537
VarGermRate(germ.counts = y, intervals = int, partial = FALSE)[1] 0.0007176543
SEGermRate(germ.counts = y, intervals = int, partial = FALSE)[1] 0.004235724
GermRateRecip(germ.counts = y, intervals = int,
              method = "coolbear", partial = FALSE)
[1] 0.1674877
GermRateRecip(germ.counts = y, intervals = int,
              method = "farooq", partial = FALSE)
[1] 0.1683168
GermSpeed(), GermSpeedAccumulated(), GermSpeedCorrected()
x <- c(0, 0, 0, 0, 4, 17, 10, 7, 1, 0, 1, 0, 0, 0)
y <- c(0, 0, 0, 0, 4, 21, 31, 38, 39, 39, 40, 40, 40, 40)
int <- 1:length(x)

# From partial germination counts
#----------------------------------------------------------------------------
GermSpeed(germ.counts = x, intervals = int)
[1] 6.138925
GermSpeedAccumulated(germ.counts = x, intervals = int)[1] 34.61567
GermSpeedCorrected(germ.counts = x, intervals = int, total.seeds = 50,
                   method = "normal")
[1] 0.1534731
GermSpeedCorrected(germ.counts = x, intervals = int, total.seeds = 50,
                   method = "accumulated")
[1] 0.8653917
# From partial germination counts (with percentages instead of counts)
#----------------------------------------------------------------------------
GermSpeed(germ.counts = x, intervals = int,
          percent = TRUE, total.seeds = 50)
[1] 12.27785
GermSpeedAccumulated(germ.counts = x, intervals = int,
                     percent = TRUE, total.seeds = 50)
[1] 69.23134
# From cumulative germination counts
#----------------------------------------------------------------------------
GermSpeed(germ.counts = y, intervals = int, partial = FALSE)
[1] 6.138925
GermSpeedAccumulated(germ.counts = y, intervals = int, partial = FALSE)[1] 34.61567
GermSpeedCorrected(germ.counts = y, intervals = int,
                   partial = FALSE, total.seeds = 50, method = "normal")
[1] 0.1534731
GermSpeedCorrected(germ.counts = y, intervals = int,
                   partial = FALSE, total.seeds = 50, method = "accumulated")
[1] 0.8653917
# From cumulative germination counts (with percentages instead of counts)
#----------------------------------------------------------------------------
GermSpeed(germ.counts = y, intervals = int, partial = FALSE,
          percent = TRUE, total.seeds = 50)
[1] 12.27785
GermSpeedAccumulated(germ.counts = y, intervals = int, partial = FALSE,
                     percent = TRUE, total.seeds = 50)
[1] 69.23134
WeightGermPercent()
x <- c(0, 0, 0, 0, 4, 17, 10, 7, 1, 0, 1, 0, 0, 0)
y <- c(0, 0, 0, 0, 4, 21, 31, 38, 39, 39, 40, 40, 40, 40)
int <- 1:length(x)

# From partial germination counts
#----------------------------------------------------------------------------
WeightGermPercent(germ.counts = x, total.seeds = 50, intervals = int)
[1] 47.42857
# From cumulative germination counts
#----------------------------------------------------------------------------
WeightGermPercent(germ.counts = y, total.seeds = 50, intervals = int,
                  partial = FALSE)
[1] 47.42857
MeanGermPercent(), MeanGermNumber()
x <- c(0, 0, 0, 0, 4, 17, 10, 7, 1, 0, 1, 0, 0, 0)
y <- c(0, 0, 0, 0, 4, 21, 31, 38, 39, 39, 40, 40, 40, 40)
int <- 1:length(x)

# From partial germination counts
#----------------------------------------------------------------------------
MeanGermPercent(germ.counts = x, total.seeds = 50, intervals = int)
[1] 5.714286
MeanGermNumber(germ.counts = x, intervals = int)[1] 2.857143
# From cumulative germination counts
#----------------------------------------------------------------------------
MeanGermPercent(germ.counts = y, total.seeds = 50, intervals = int, partial = FALSE)
[1] 5.714286
MeanGermNumber(germ.counts = y, intervals = int, partial = FALSE)[1] 2.857143
# From number of germinated seeds
#----------------------------------------------------------------------------
MeanGermPercent(germinated.seeds = 40, total.seeds = 50, intervals = int)
[1] 5.714286
TimsonsIndex(), GermRateGeorge()
x <- c(0, 0, 0, 0, 4, 17, 10, 7, 1, 0, 1, 0, 0, 0)
y <- c(0, 0, 0, 0, 4, 21, 31, 38, 39, 39, 40, 40, 40, 40)
int <- 1:length(x)

# From partial germination counts
#----------------------------------------------------------------------------
# Without max specified
TimsonsIndex(germ.counts = x, intervals = int, total.seeds = 50)
[1] 664
TimsonsIndex(germ.counts = x, intervals = int, total.seeds = 50,
             modification = "none")
[1] 664
TimsonsIndex(germ.counts = x, intervals = int, total.seeds = 50,
             modification = "labouriau")
[1] 8.3
TimsonsIndex(germ.counts = x, intervals = int, total.seeds = 50,
             modification = "khanungar")
[1] 47.42857
GermRateGeorge(germ.counts = x, intervals = int)[1] 332
# With max specified
TimsonsIndex(germ.counts = x, intervals = int, total.seeds = 50, max = 10)
[1] 344
TimsonsIndex(germ.counts = x, intervals = int, total.seeds = 50,
             max = 10, modification = "none")
[1] 344
TimsonsIndex(germ.counts = x, intervals = int, total.seeds = 50,
             max = 10, modification = "labouriau")
[1] 4.410256
TimsonsIndex(germ.counts = x, intervals = int, total.seeds = 50,
             max = 10, modification = "khanungar")
[1] 24.57143
GermRateGeorge(germ.counts = x, intervals = int, max = 10)[1] 172
GermRateGeorge(germ.counts = x, intervals = int, max = 14)[1] 332
# From cumulative germination counts
#----------------------------------------------------------------------------
# Without max specified
TimsonsIndex(germ.counts = y, intervals = int, partial = FALSE,
             total.seeds = 50)
[1] 664
TimsonsIndex(germ.counts = y, intervals = int, partial = FALSE,
             total.seeds = 50,
             modification = "none")
[1] 664
TimsonsIndex(germ.counts = y, intervals = int, partial = FALSE,
             total.seeds = 50,
             modification = "labouriau")
[1] 8.3
TimsonsIndex(germ.counts = y, intervals = int, partial = FALSE,
             total.seeds = 50,
             modification = "khanungar")
[1] 47.42857
GermRateGeorge(germ.counts = y, intervals = int, partial = FALSE)[1] 332
# With max specified
TimsonsIndex(germ.counts = y, intervals = int, partial = FALSE,
             total.seeds = 50, max = 10)
[1] 344
TimsonsIndex(germ.counts = y, intervals = int, partial = FALSE,
             total.seeds = 50,
             max = 10, modification = "none")
[1] 344
TimsonsIndex(germ.counts = y, intervals = int, partial = FALSE,
             total.seeds = 50,
             max = 10, modification = "labouriau")
[1] 4.410256
TimsonsIndex(germ.counts = y, intervals = int, partial = FALSE,
             total.seeds = 50,
             max = 10, modification = "khanungar")
[1] 24.57143
GermRateGeorge(germ.counts = y, intervals = int, partial = FALSE,
               max = 10)
[1] 172
GermRateGeorge(germ.counts = y, intervals = int, partial = FALSE,
               max = 14)
[1] 332
GermIndex()
x <- c(0, 0, 0, 0, 4, 17, 10, 7, 1, 0, 1, 0, 0, 0)
y <- c(0, 0, 0, 0, 4, 21, 31, 38, 39, 39, 40, 40, 40, 40)
int <- 1:length(x)

# From partial germination counts
#----------------------------------------------------------------------------
GermIndex(germ.counts = x, intervals = int, total.seeds = 50)
[1] 5.84
GermIndex(germ.counts = x, intervals = int, total.seeds = 50,
          modification = "none")
[1] 5.84
GermIndex(germ.counts = x, intervals = int, total.seeds = 50,
          modification = "santanaranal")
[1] 7.3
# From cumulative germination counts
#----------------------------------------------------------------------------
GermIndex(germ.counts = y, intervals = int, partial = FALSE,
          total.seeds = 50)
[1] 5.84
GermIndex(germ.counts = y, intervals = int, partial = FALSE,
          total.seeds = 50,
          modification = "none")
[1] 5.84
GermIndex(germ.counts = y, intervals = int, partial = FALSE,
          total.seeds = 50,
          modification = "santanaranal")
[1] 7.3
EmergenceRateIndex()
x <- c(0, 0, 0, 0, 4, 17, 10, 7, 1, 0, 1, 0, 0, 0)
y <- c(0, 0, 0, 0, 4, 21, 31, 38, 39, 39, 40, 40, 40, 40)
int <- 1:length(x)

# From partial germination counts
#----------------------------------------------------------------------------
EmergenceRateIndex(germ.counts = x, intervals = int, total.seeds = 50)
[1] 292
EmergenceRateIndex(germ.counts = x, intervals = int, total.seeds = 50,
                   method = "shmueligoldberg")
[1] 292
EmergenceRateIndex(germ.counts = x, intervals = int, total.seeds = 50,
                   method = "sgsantanaranal")
[1] 7.3
EmergenceRateIndex(germ.counts = x, intervals = int, total.seeds = 50,
                   method = "bilbrowanjura")
[1] 5.970149
EmergenceRateIndex(germ.counts = x, intervals = int, total.seeds = 50,
                   method = "fakorede")
[1] 8.375
# From cumulative germination counts
#----------------------------------------------------------------------------
EmergenceRateIndex(germ.counts = y, intervals = int, total.seeds = 50,
                   partial = FALSE)
[1] 292
EmergenceRateIndex(germ.counts = y, intervals = int, total.seeds = 50,
                   partial = FALSE,
                   method = "shmueligoldberg")
[1] 292
EmergenceRateIndex(germ.counts = y, intervals = int, total.seeds = 50,
                   partial = FALSE,
                   method = "sgsantanaranal")
[1] 7.3
EmergenceRateIndex(germ.counts = y, intervals = int, total.seeds = 50,
                   partial = FALSE,
                   method = "bilbrowanjura")
[1] 5.970149
EmergenceRateIndex(germ.counts = y, intervals = int, total.seeds = 50,
                   partial = FALSE,
                   method = "fakorede")
[1] 8.375
PeakValue(), GermValue()
x <- c(0, 0, 34, 40, 21, 10, 4, 5, 3, 5, 8, 7, 7, 6, 6, 4, 0, 2, 0, 2)
y <- c(0, 0, 34, 74, 95, 105, 109, 114, 117, 122, 130, 137, 144, 150,
      156, 160, 160, 162, 162, 164)
int <- 1:length(x)
total.seeds = 200

# From partial germination counts
#----------------------------------------------------------------------------
PeakValue(germ.counts = x, intervals = int, total.seeds = 200)
[1] 9.5
GermValue(germ.counts = x, intervals = int, total.seeds = 200,
          method = "czabator")
$`Germination Value`
[1] 38.95
[[2]]
germ.counts intervals Cumulative.germ.counts Cumulative.germ.percent
3 34 3 34 17.0
4 40 4 74 37.0
5 21 5 95 47.5
6 10 6 105 52.5
7 4 7 109 54.5
8 5 8 114 57.0
9 3 9 117 58.5
10 5 10 122 61.0
11 8 11 130 65.0
12 7 12 137 68.5
13 7 13 144 72.0
14 6 14 150 75.0
15 6 15 156 78.0
16 4 16 160 80.0
17 0 17 160 80.0
18 2 18 162 81.0
19 0 19 162 81.0
20 2 20 164 82.0
DGS
3 5.666667
4 9.250000
5 9.500000
6 8.750000
7 7.785714
8 7.125000
9 6.500000
10 6.100000
11 5.909091
12 5.708333
13 5.538462
14 5.357143
15 5.200000
16 5.000000
17 4.705882
18 4.500000
19 4.263158
20 4.100000
GermValue(germ.counts = x, intervals = int, total.seeds = 200,
          method = "dp", k = 10)
$`Germination Value`
[1] 53.36595
[[2]]
germ.counts intervals Cumulative.germ.counts Cumulative.germ.percent
3 34 3 34 17.0
4 40 4 74 37.0
5 21 5 95 47.5
6 10 6 105 52.5
7 4 7 109 54.5
8 5 8 114 57.0
9 3 9 117 58.5
10 5 10 122 61.0
11 8 11 130 65.0
12 7 12 137 68.5
13 7 13 144 72.0
14 6 14 150 75.0
15 6 15 156 78.0
16 4 16 160 80.0
17 0 17 160 80.0
18 2 18 162 81.0
19 0 19 162 81.0
20 2 20 164 82.0
DGS SumDGSbyN GV
3 5.666667 5.666667 9.633333
4 9.250000 7.458333 27.595833
5 9.500000 8.138889 38.659722
6 8.750000 8.291667 43.531250
7 7.785714 8.190476 44.638095
8 7.125000 8.012897 45.673512
9 6.500000 7.796769 45.611097
10 6.100000 7.584673 46.266503
11 5.909091 7.398497 48.090230
12 5.708333 7.229481 49.521942
13 5.538462 7.075752 50.945411
14 5.357143 6.932534 51.994006
15 5.200000 6.799262 53.034246
16 5.000000 6.670744 53.365948
17 4.705882 6.539753 52.318022
18 4.500000 6.412268 51.939373
19 4.263158 6.285850 50.915385
20 4.100000 6.164414 50.548194
$testend
[1] 16
GermValue(germ.counts = x, intervals = int, total.seeds = 200,
          method = "czabator", from.onset = FALSE)
$`Germination Value`
[1] 38.95
[[2]]
germ.counts intervals Cumulative.germ.counts Cumulative.germ.percent
1 0 1 0 0.0
2 0 2 0 0.0
3 34 3 34 17.0
4 40 4 74 37.0
5 21 5 95 47.5
6 10 6 105 52.5
7 4 7 109 54.5
8 5 8 114 57.0
9 3 9 117 58.5
10 5 10 122 61.0
11 8 11 130 65.0
12 7 12 137 68.5
13 7 13 144 72.0
14 6 14 150 75.0
15 6 15 156 78.0
16 4 16 160 80.0
17 0 17 160 80.0
18 2 18 162 81.0
19 0 19 162 81.0
20 2 20 164 82.0
DGS
1 0.000000
2 0.000000
3 5.666667
4 9.250000
5 9.500000
6 8.750000
7 7.785714
8 7.125000
9 6.500000
10 6.100000
11 5.909091
12 5.708333
13 5.538462
14 5.357143
15 5.200000
16 5.000000
17 4.705882
18 4.500000
19 4.263158
20 4.100000
GermValue(germ.counts = x, intervals = int, total.seeds = 200,
          method = "dp", k = 10, from.onset = FALSE)
$`Germination Value`
[1] 46.6952
[[2]]
germ.counts intervals Cumulative.germ.counts Cumulative.germ.percent
1 0 1 0 0.0
2 0 2 0 0.0
3 34 3 34 17.0
4 40 4 74 37.0
5 21 5 95 47.5
6 10 6 105 52.5
7 4 7 109 54.5
8 5 8 114 57.0
9 3 9 117 58.5
10 5 10 122 61.0
11 8 11 130 65.0
12 7 12 137 68.5
13 7 13 144 72.0
14 6 14 150 75.0
15 6 15 156 78.0
16 4 16 160 80.0
17 0 17 160 80.0
18 2 18 162 81.0
19 0 19 162 81.0
20 2 20 164 82.0
DGS SumDGSbyN GV
1 0.000000 0.000000 0.000000
2 0.000000 0.000000 0.000000
3 5.666667 1.888889 3.211111
4 9.250000 3.729167 13.797917
5 9.500000 4.883333 23.195833
6 8.750000 5.527778 29.020833
7 7.785714 5.850340 31.884354
8 7.125000 6.009673 34.255134
9 6.500000 6.064153 35.475298
10 6.100000 6.067738 37.013202
11 5.909091 6.053316 39.346552
12 5.708333 6.024567 41.268285
13 5.538462 5.987174 43.107655
14 5.357143 5.942172 44.566291
15 5.200000 5.892694 45.963013
16 5.000000 5.836901 46.695205
17 4.705882 5.770370 46.162961
18 4.500000 5.699794 46.168331
19 4.263158 5.624182 45.555871
20 4.100000 5.547972 45.493374
$testend
[1] 16
# From cumulative germination counts
#----------------------------------------------------------------------------
PeakValue(germ.counts = y, interval = int, total.seeds = 200,
          partial = FALSE)
[1] 9.5
GermValue(germ.counts = y, intervals = int, total.seeds = 200,
          partial = FALSE, method = "czabator")
$`Germination Value`
[1] 38.95
[[2]]
germ.counts intervals Cumulative.germ.counts Cumulative.germ.percent
3 34 3 34 17.0
4 40 4 74 37.0
5 21 5 95 47.5
6 10 6 105 52.5
7 4 7 109 54.5
8 5 8 114 57.0
9 3 9 117 58.5
10 5 10 122 61.0
11 8 11 130 65.0
12 7 12 137 68.5
13 7 13 144 72.0
14 6 14 150 75.0
15 6 15 156 78.0
16 4 16 160 80.0
17 0 17 160 80.0
18 2 18 162 81.0
19 0 19 162 81.0
20 2 20 164 82.0
DGS
3 5.666667
4 9.250000
5 9.500000
6 8.750000
7 7.785714
8 7.125000
9 6.500000
10 6.100000
11 5.909091
12 5.708333
13 5.538462
14 5.357143
15 5.200000
16 5.000000
17 4.705882
18 4.500000
19 4.263158
20 4.100000
GermValue(germ.counts = y, intervals = int, total.seeds = 200,
          partial = FALSE, method = "dp", k = 10)
$`Germination Value`
[1] 53.36595
[[2]]
germ.counts intervals Cumulative.germ.counts Cumulative.germ.percent
3 34 3 34 17.0
4 40 4 74 37.0
5 21 5 95 47.5
6 10 6 105 52.5
7 4 7 109 54.5
8 5 8 114 57.0
9 3 9 117 58.5
10 5 10 122 61.0
11 8 11 130 65.0
12 7 12 137 68.5
13 7 13 144 72.0
14 6 14 150 75.0
15 6 15 156 78.0
16 4 16 160 80.0
17 0 17 160 80.0
18 2 18 162 81.0
19 0 19 162 81.0
20 2 20 164 82.0
DGS SumDGSbyN GV
3 5.666667 5.666667 9.633333
4 9.250000 7.458333 27.595833
5 9.500000 8.138889 38.659722
6 8.750000 8.291667 43.531250
7 7.785714 8.190476 44.638095
8 7.125000 8.012897 45.673512
9 6.500000 7.796769 45.611097
10 6.100000 7.584673 46.266503
11 5.909091 7.398497 48.090230
12 5.708333 7.229481 49.521942
13 5.538462 7.075752 50.945411
14 5.357143 6.932534 51.994006
15 5.200000 6.799262 53.034246
16 5.000000 6.670744 53.365948
17 4.705882 6.539753 52.318022
18 4.500000 6.412268 51.939373
19 4.263158 6.285850 50.915385
20 4.100000 6.164414 50.548194
$testend
[1] 16
GermValue(germ.counts = y, intervals = int, total.seeds = 200,
          partial = FALSE, method = "czabator", from.onset = FALSE)
$`Germination Value`
[1] 38.95
[[2]]
germ.counts intervals Cumulative.germ.counts Cumulative.germ.percent
1 0 1 0 0.0
2 0 2 0 0.0
3 34 3 34 17.0
4 40 4 74 37.0
5 21 5 95 47.5
6 10 6 105 52.5
7 4 7 109 54.5
8 5 8 114 57.0
9 3 9 117 58.5
10 5 10 122 61.0
11 8 11 130 65.0
12 7 12 137 68.5
13 7 13 144 72.0
14 6 14 150 75.0
15 6 15 156 78.0
16 4 16 160 80.0
17 0 17 160 80.0
18 2 18 162 81.0
19 0 19 162 81.0
20 2 20 164 82.0
DGS
1 0.000000
2 0.000000
3 5.666667
4 9.250000
5 9.500000
6 8.750000
7 7.785714
8 7.125000
9 6.500000
10 6.100000
11 5.909091
12 5.708333
13 5.538462
14 5.357143
15 5.200000
16 5.000000
17 4.705882
18 4.500000
19 4.263158
20 4.100000
GermValue(germ.counts = y, intervals = int, total.seeds = 200,
          partial = FALSE, method = "dp", k = 10, from.onset = FALSE)
$`Germination Value`
[1] 46.6952
[[2]]
germ.counts intervals Cumulative.germ.counts Cumulative.germ.percent
1 0 1 0 0.0
2 0 2 0 0.0
3 34 3 34 17.0
4 40 4 74 37.0
5 21 5 95 47.5
6 10 6 105 52.5
7 4 7 109 54.5
8 5 8 114 57.0
9 3 9 117 58.5
10 5 10 122 61.0
11 8 11 130 65.0
12 7 12 137 68.5
13 7 13 144 72.0
14 6 14 150 75.0
15 6 15 156 78.0
16 4 16 160 80.0
17 0 17 160 80.0
18 2 18 162 81.0
19 0 19 162 81.0
20 2 20 164 82.0
DGS SumDGSbyN GV
1 0.000000 0.000000 0.000000
2 0.000000 0.000000 0.000000
3 5.666667 1.888889 3.211111
4 9.250000 3.729167 13.797917
5 9.500000 4.883333 23.195833
6 8.750000 5.527778 29.020833
7 7.785714 5.850340 31.884354
8 7.125000 6.009673 34.255134
9 6.500000 6.064153 35.475298
10 6.100000 6.067738 37.013202
11 5.909091 6.053316 39.346552
12 5.708333 6.024567 41.268285
13 5.538462 5.987174 43.107655
14 5.357143 5.942172 44.566291
15 5.200000 5.892694 45.963013
16 5.000000 5.836901 46.695205
17 4.705882 5.770370 46.162961
18 4.500000 5.699794 46.168331
19 4.263158 5.624182 45.555871
20 4.100000 5.547972 45.493374
$testend
[1] 16
CUGerm()
x <- c(0, 0, 0, 0, 4, 17, 10, 7, 1, 0, 1, 0, 0, 0)
y <- c(0, 0, 0, 0, 4, 21, 31, 38, 39, 39, 40, 40, 40, 40)
int <- 1:length(x)

# From partial germination counts
#----------------------------------------------------------------------------
CUGerm(germ.counts = x, intervals = int)
[1] 0.7092199
# From cumulative germination counts
#----------------------------------------------------------------------------
CUGerm(germ.counts = y, intervals = int, partial = FALSE)
[1] 0.7092199
GermSynchrony(), GermUncertainty()
x <- c(0, 0, 0, 0, 4, 17, 10, 7, 1, 0, 1, 0, 0, 0)
y <- c(0, 0, 0, 0, 4, 21, 31, 38, 39, 39, 40, 40, 40, 40)
int <- 1:length(x)

# From partial germination counts
#----------------------------------------------------------------------------
GermSynchrony(germ.counts = x, intervals = int)
[1] 0.2666667
GermUncertainty(germ.counts = x, intervals = int)[1] 2.062987
# From cumulative germination counts
#----------------------------------------------------------------------------
GermSynchrony(germ.counts = y, intervals = int, partial = FALSE)
[1] 0.2666667
GermUncertainty(germ.counts = y, intervals = int, partial = FALSE)[1] 2.062987Non-linear regression analysis
Several mathematical functions have been used to fit the cumulative
germination count data and describe the germination process by
non-linear regression analysis. They include functions such as
Richard’s, Weibull, logistic, log-logistic, gaussian, four-parameter
hill function etc. Currently germinationmetrics implements
the four-parameter hill function to fit the count data and computed
various associated metrics.
Four-parameter hill function
The four-parameter hill function defined as follows (El-Kassaby et al., 2008).
\[ f(x) = y = y_0 + \frac{ax^b}{x^b+c^b} \] Where, \(y\) is the cumulative germination percentage at time \(x\), \(y_{0}\) is the intercept on the y axis, \(a\) is the asymptote, \(b\) is a mathematical parameter controlling the shape and steepness of the germination curve and \(c\) is the “half-maximal activation level”.
this function can also be be reparameterized by substituting \(b\) with \(e^{\beta}\) to constraint \(b\) to positive values only.
\[ y = y_{0}+\frac{ax^{e^{\beta}}}{c^{e^{\beta}}+x^{e^{\beta}}} \] Where, \(b = e^{\beta}\) and \(\beta = \log_{e}(b)\).
The details of various parameters that are computed from this function are given in Table 4.
Table 4 Germination parameters estimated from the four-parameter hill function.
| Germination parameters | Details | Unit | Measures |
|---|---|---|---|
| y intercept (\(y_{0}\)) | The intercept on the y axis. | ||
| Asymptote (\(a\)) | It is the maximum cumulative germination percentage, which is equivalent to germination capacity. | % | Germination capacity |
| Shape and steepness (\(b\)) | Mathematical parameter controlling the shape and steepness of the germination curve. The larger the \(b\) , the steeper the rise toward the asymptote \(a\), and the shorter the time between germination onset and maximum germination. | Germination rate | |
| Half-maximal activation level (\(c\)) | Time required for 50% of viable seeds to germinate. | time | Germination time |
| \(lag\) | It is the time at germination onset and is computed by solving
four-parameter hill function after setting y to 0 as follows. \[lag = b\sqrt{\frac{-y_{0}c^{b}}{a + y_{0}}}\] |
time | Germination time |
| \(D_{lag-50}\) | The duration between the time at germination onset (\(lag\)) and that at 50% germination (\(c\)). | time | Germination time |
| \(t_{50_{total}}\) | Time required for 50% of total seeds to germinate. | time | Germination time |
| \(t_{50_{germinated}}\) | Time required for 50% of viable/germinated seeds to germinate | time | Germination time |
| \(t_{x_{total}}\) | Time required for \(x\)% of total seeds to germinate. | time | Germination time |
| \(t_{x_{germinated}}\) | Time required for \(x\)% of viable/germinated seeds to germinate | time | Germination time |
| Uniformity (\(U_{t_{max}-t_{min}}\)) | It is the time interval between the percentages of viable seeds
specified in the arguments umin and umin to
germinate. |
time | Germination time |
| Time at maximum germination rate (\(TMGR\)) | The partial derivative of the four-parameter hill function gives the
instantaneous rate of germination (\(s\)) as follows. \[s = \frac{\partial y}{\partial x} = \frac{abc^{b}x^{b-1}}{(c^{b}+x^{b})^{2}}\] From this function for instantaneous rate of germination, \(TMGR\) can be estimated as follows. \[TMGR = b \sqrt{\frac{c^{b}(b-1)}{b+1}}\] It represents the point in time when the instantaneous rate of germination starts to decline. |
time | Germination time |
| Area under the curve (\(AUC\)) | It is obtained by integration of the fitted curve between time 0 and
time specified in the argument tmax. |
Mixed | |
| \(MGT\) | Calculated by integration of the fitted curve and proper normalisation. | time | Germination time |
| \(Skewness\) | It is computed as follows. \[\frac{MGT}{t_{50_{germinated}}}\] |
FourPHFfit()
x <- c(0, 0, 0, 0, 4, 17, 10, 7, 1, 0, 1, 0, 0, 0)
y <- c(0, 0, 0, 0, 4, 21, 31, 38, 39, 39, 40, 40, 40, 40)
int <- 1:length(x)
total.seeds = 50

# From partial germination counts
#----------------------------------------------------------------------------
FourPHFfit(germ.counts = x, intervals = int, total.seeds = 50, tmax = 20)
$data
gp csgp intervals
1 0 0 1
2 0 0 2
3 0 0 3
4 0 0 4
5 8 8 5
6 34 42 6
7 20 62 7
8 14 76 8
9 2 78 9
10 0 78 10
11 2 80 11
12 0 80 12
13 0 80 13
14 0 80 14
$Parameters
term estimate std.error statistic p.value
1 bta 2.290709 0.05602634 40.88628 2.965932e-14
2 c 6.034954 0.03872162 155.85488 3.270089e-21
$Fit
sigma isConv finTol logLik AIC BIC deviance df.residual
1 1.61522 TRUE 7.105427e-14 -25.49868 56.99736 58.91453 31.30723 12
nobs
1 14
$a
[1] 80
$b
[1] 9.881937
$c
[1] 6.034954
$y0
[1] 0
$lag
[1] 0
$Dlag50
[1] 6.034954
$t50.total
[1] 6.355121
$txp.total
10 60
4.956264 6.744598
$t50.Germinated
[1] 6.034954
$txp.Germinated
10 60
4.831807 6.287724
$Uniformity
90 10 uniformity
7.537690 4.831807 2.705882
$TMGR
[1] 5.912194
$AUC
[1] 1108.976
$MGT
[1] 6.632252
$Skewness
[1] 1.098973
$msg
[1] "#1. success "
$isConv
[1] TRUE
$model
Nonlinear regression model
model: csgp ~ FourPHF_fixa_fixy0(x = intervals, a = max(csgp), bta, c)
data: data
bta c
2.291 6.035
residual sum-of-squares: 31.31
Algorithm: multifit/levenberg-marquardt, (scaling: levenberg, solver: qr)
Number of iterations to convergence: 9
Achieved convergence tolerance: 7.105e-14
attr(,"class")
[1] "FourPHFfit" "list"
# From cumulative germination counts
#----------------------------------------------------------------------------
FourPHFfit(germ.counts = y, intervals = int, total.seeds = 50, tmax = 20,
           partial = FALSE)
$data
gp csgp intervals
1 0 0 1
2 0 0 2
3 0 0 3
4 0 0 4
5 8 8 5
6 34 42 6
7 20 62 7
8 14 76 8
9 2 78 9
10 0 78 10
11 2 80 11
12 0 80 12
13 0 80 13
14 0 80 14
$Parameters
term estimate std.error statistic p.value
1 bta 2.290709 0.05602634 40.88628 2.965932e-14
2 c 6.034954 0.03872162 155.85488 3.270089e-21
$Fit
sigma isConv finTol logLik AIC BIC deviance df.residual
1 1.61522 TRUE 7.105427e-14 -25.49868 56.99736 58.91453 31.30723 12
nobs
1 14
$a
[1] 80
$b
[1] 9.881937
$c
[1] 6.034954
$y0
[1] 0
$lag
[1] 0
$Dlag50
[1] 6.034954
$t50.total
[1] 6.355121
$txp.total
10 60
4.956264 6.744598
$t50.Germinated
[1] 6.034954
$txp.Germinated
10 60
4.831807 6.287724
$Uniformity
90 10 uniformity
7.537690 4.831807 2.705882
$TMGR
[1] 5.912194
$AUC
[1] 1108.976
$MGT
[1] 6.632252
$Skewness
[1] 1.098973
$msg
[1] "#1. success "
$isConv
[1] TRUE
$model
Nonlinear regression model
model: csgp ~ FourPHF_fixa_fixy0(x = intervals, a = max(csgp), bta, c)
data: data
bta c
2.291 6.035
residual sum-of-squares: 31.31
Algorithm: multifit/levenberg-marquardt, (scaling: levenberg, solver: qr)
Number of iterations to convergence: 9
Achieved convergence tolerance: 7.105e-14
attr(,"class")
[1] "FourPHFfit" "list"
x <- c(0, 0, 0, 0, 4, 17, 10, 7, 1, 0, 1, 0, 0, 0)
y <- c(0, 0, 0, 0, 4, 21, 31, 38, 39, 39, 40, 40, 40, 40)
int <- 1:length(x)
total.seeds = 50

# From partial germination counts
#----------------------------------------------------------------------------
fit1 <- FourPHFfit(germ.counts = x, intervals = int,
                   total.seeds = 50, tmax = 20)

# From cumulative germination counts
#----------------------------------------------------------------------------
fit2 <- FourPHFfit(germ.counts = y, intervals = int,
                   total.seeds = 50, tmax = 20, partial = FALSE)

# Default plots
plot(fit1)
Warning in geom_segment(aes(x = UfmMin, xend = UfmMax, y = ypos2, yend = ypos2), :
[1m
[22mAll aesthetics have length 1, but the data has 14 rows.
[36mℹ
[39m Please consider using `annotate()` or provide this layer with data containing
a single row.Warning in geom_segment(aes(x = UfmMax, xend = UfmMin, y = ypos2, yend = ypos2), :
[1m
[22mAll aesthetics have length 1, but the data has 14 rows.
[36mℹ
[39m Please consider using `annotate()` or provide this layer with data containing
a single row.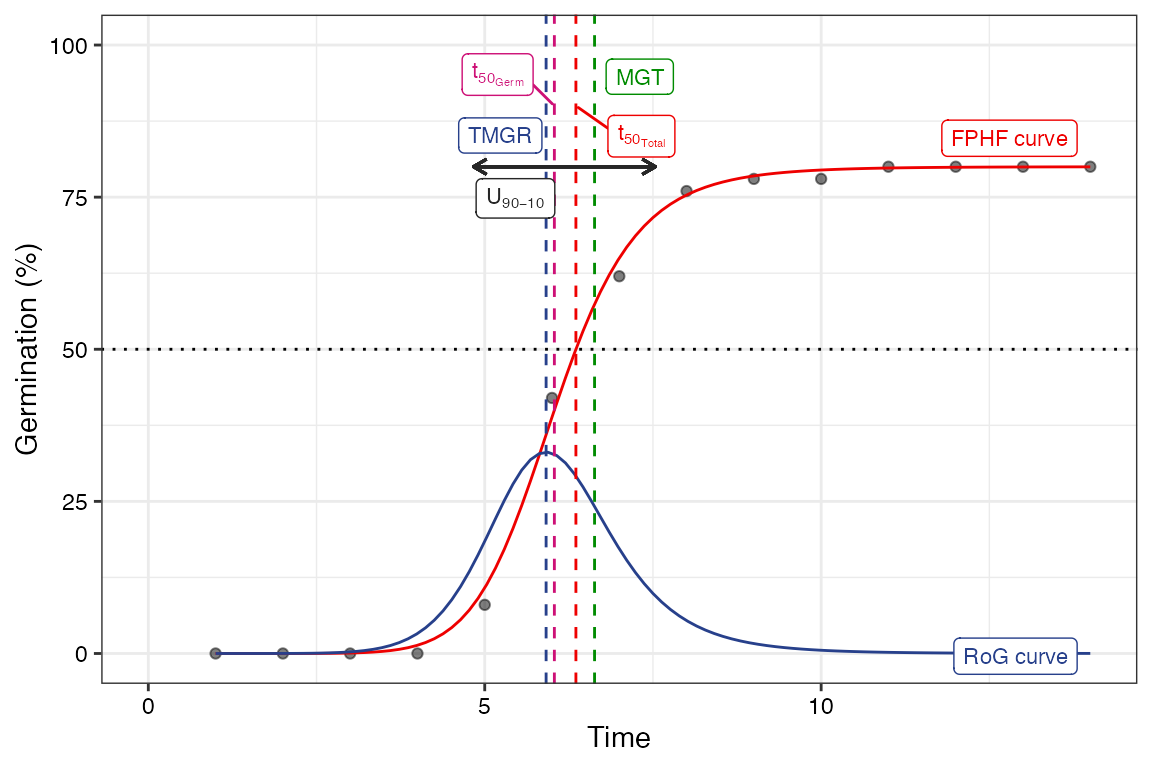
plot(fit2)Warning in geom_segment(aes(x = UfmMin, xend = UfmMax, y = ypos2, yend = ypos2), :
[1m
[22mAll aesthetics have length 1, but the data has 14 rows.
[36mℹ
[39m Please consider using `annotate()` or provide this layer with data containing
a single row.
[1m
[22mAll aesthetics have length 1, but the data has 14 rows.
[36mℹ
[39m Please consider using `annotate()` or provide this layer with data containing
a single row.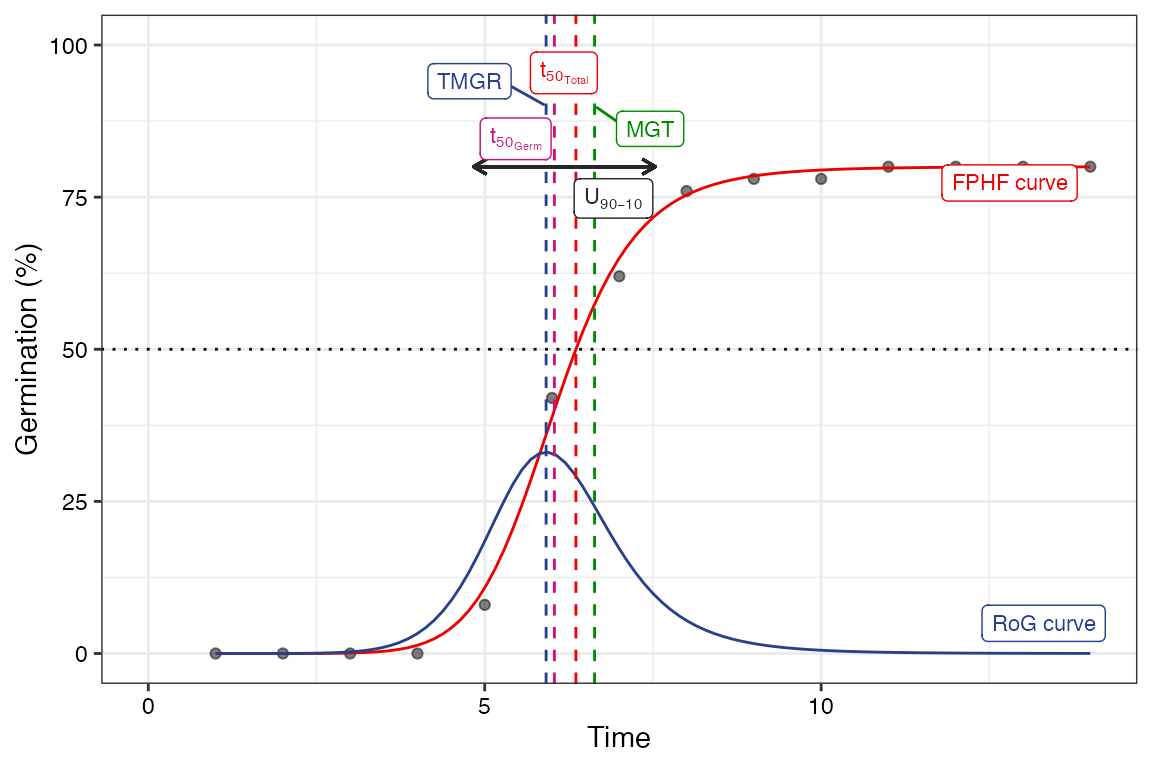
# No labels
plot(fit1, plotlabels = FALSE)
Warning in geom_segment(aes(x = UfmMin, xend = UfmMax, y = ypos2, yend = ypos2), :
[1m
[22mAll aesthetics have length 1, but the data has 14 rows.
[36mℹ
[39m Please consider using `annotate()` or provide this layer with data containing
a single row.
[1m
[22mAll aesthetics have length 1, but the data has 14 rows.
[36mℹ
[39m Please consider using `annotate()` or provide this layer with data containing
a single row.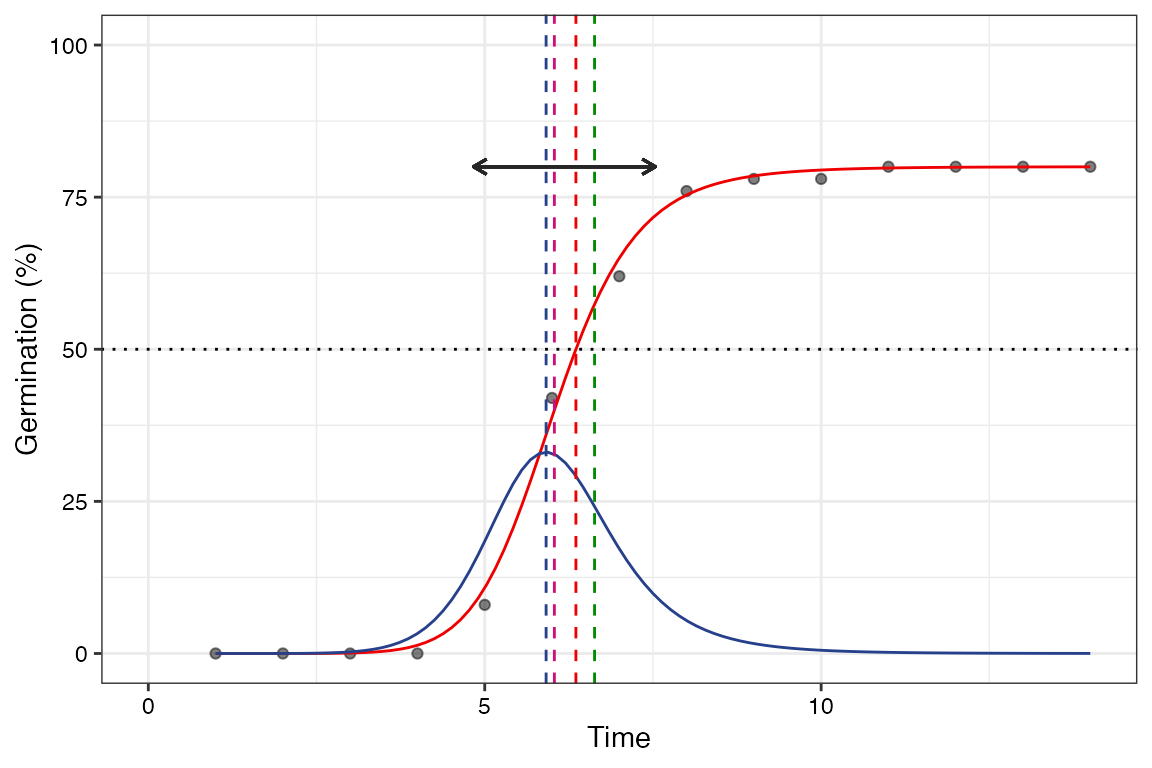
plot(fit2, plotlabels = FALSE)Warning in geom_segment(aes(x = UfmMin, xend = UfmMax, y = ypos2, yend = ypos2), :
[1m
[22mAll aesthetics have length 1, but the data has 14 rows.
[36mℹ
[39m Please consider using `annotate()` or provide this layer with data containing
a single row.
[1m
[22mAll aesthetics have length 1, but the data has 14 rows.
[36mℹ
[39m Please consider using `annotate()` or provide this layer with data containing
a single row.
# Only the FPHF curve
plot(fit1, rog = FALSE, t50.total = FALSE, t50.germ = FALSE,
     tmgr = FALSE, mgt = FALSE, uniformity = FALSE)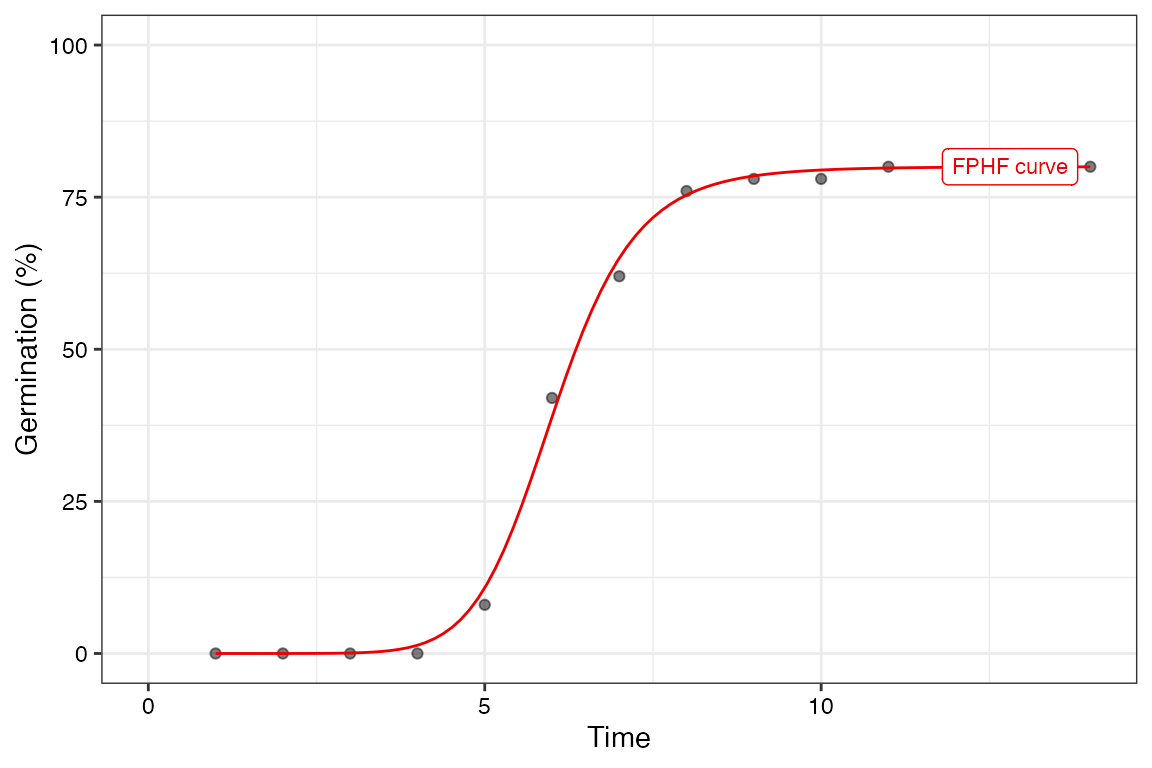
plot(fit2, rog = FALSE, t50.total = FALSE, t50.germ = FALSE,
     tmgr = FALSE, mgt = FALSE, uniformity = FALSE)
# Without y axis limits adjustment
plot(fit1, limits = FALSE)
Warning in geom_segment(aes(x = UfmMin, xend = UfmMax, y = ypos2, yend = ypos2), :
[1m
[22mAll aesthetics have length 1, but the data has 14 rows.
[36mℹ
[39m Please consider using `annotate()` or provide this layer with data containing
a single row.
[1m
[22mAll aesthetics have length 1, but the data has 14 rows.
[36mℹ
[39m Please consider using `annotate()` or provide this layer with data containing
a single row.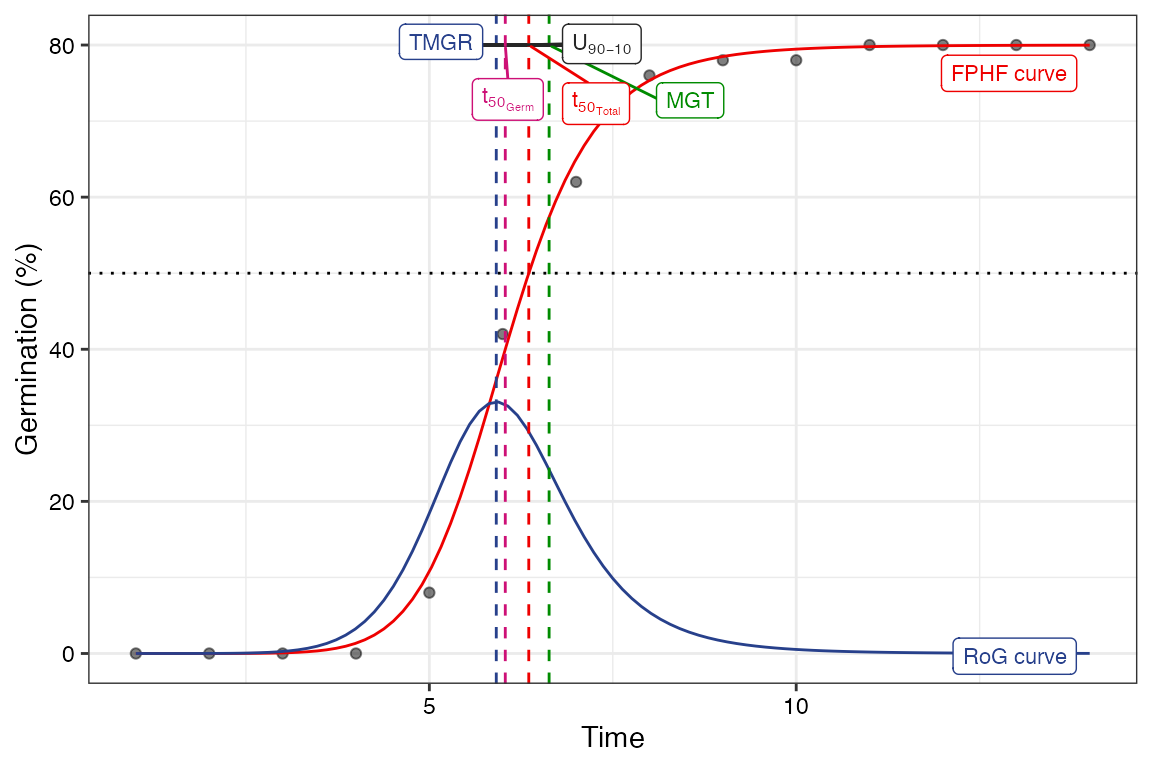
plot(fit2, limits = FALSE)Warning in geom_segment(aes(x = UfmMin, xend = UfmMax, y = ypos2, yend = ypos2), :
[1m
[22mAll aesthetics have length 1, but the data has 14 rows.
[36mℹ
[39m Please consider using `annotate()` or provide this layer with data containing
a single row.
[1m
[22mAll aesthetics have length 1, but the data has 14 rows.
[36mℹ
[39m Please consider using `annotate()` or provide this layer with data containing
a single row.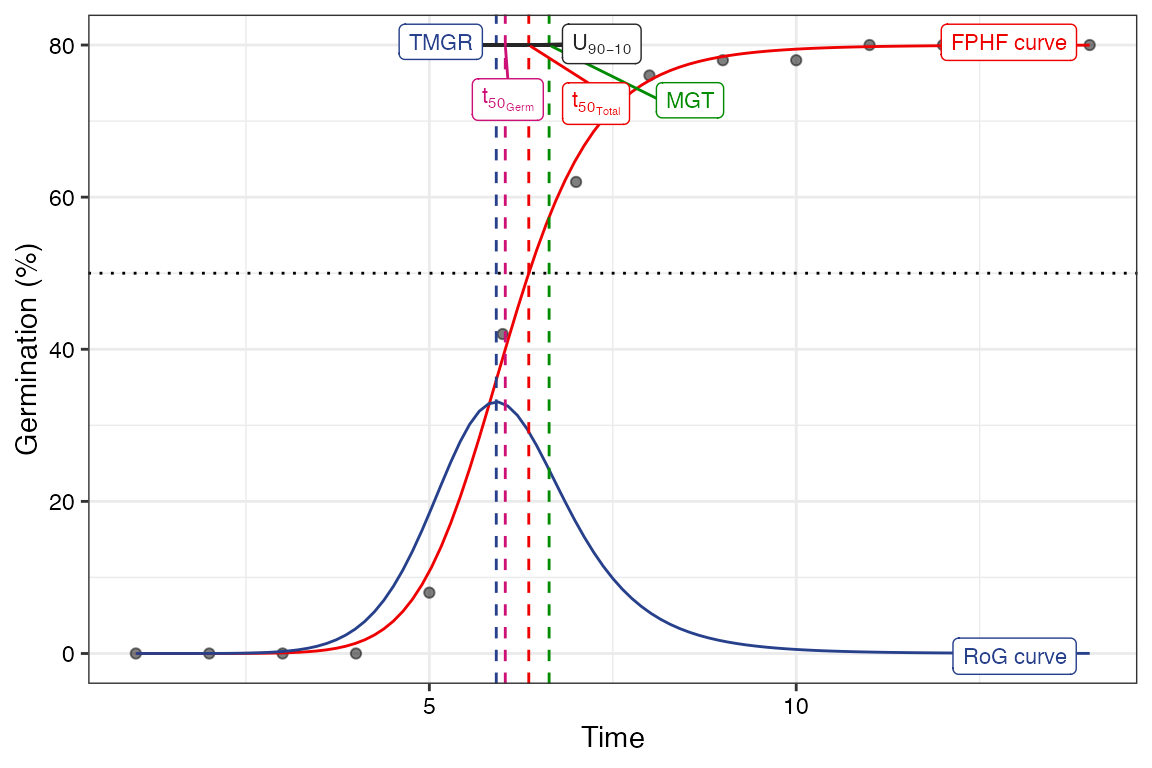
Wrapper functions
Wrapper functions germination.indices() and
FourPHFfit.bulk() are available in the package for
computing results for multiple samples in batch from a data frame of
germination counts recorded at specific time intervals.
germination.indices()
This wrapper function can be used to compute several germination indices simultaneously for multiple samples in batch.
data(gcdata)

counts.per.intervals <- c("Day01", "Day02", "Day03", "Day04", "Day05",
                          "Day06", "Day07", "Day08", "Day09", "Day10",
                          "Day11", "Day12", "Day13", "Day14")
germination.indices(gcdata, total.seeds.col = "Total Seeds",
                    counts.intervals.cols = counts.per.intervals,
                    intervals = 1:14, partial = TRUE, max.int = 5)
Genotype Rep Day01 Day02 Day03 Day04 Day05 Day06 Day07 Day08 Day09 Day10
1 G1 1 0 0 0 0 4 17 10 7 1 0
2 G2 1 0 0 0 1 3 15 13 6 2 1
3 G3 1 0 0 0 2 3 18 9 8 2 1
4 G4 1 0 0 0 0 4 19 12 6 2 1
5 G5 1 0 0 0 0 5 20 12 8 1 0
6 G1 2 0 0 0 0 3 21 11 7 1 1
7 G2 2 0 0 0 0 4 18 11 7 1 0
8 G3 2 0 0 0 1 3 14 12 6 2 1
9 G4 2 0 0 0 1 3 19 10 8 1 1
10 G5 2 0 0 0 0 4 18 13 6 2 1
11 G1 3 0 0 0 0 5 21 11 8 1 0
12 G2 3 0 0 0 0 3 20 10 7 1 1
13 G3 3 0 0 0 0 4 19 12 8 1 1
14 G4 3 0 0 0 0 3 21 11 6 1 0
15 G5 3 0 0 0 0 4 17 10 8 1 1
Day11 Day12 Day13 Day14 Total Seeds GermPercent PeakGermPercent
1 1 0 0 0 50 80.00000 34.00000
2 0 1 0 0 51 82.35294 29.41176
3 1 1 0 0 48 93.75000 37.50000
4 1 1 0 0 51 90.19608 37.25490
5 0 1 1 0 50 96.00000 40.00000
6 1 1 0 0 49 93.87755 42.85714
7 1 0 0 0 48 87.50000 37.50000
8 0 1 0 0 47 85.10638 29.78723
9 1 1 0 0 52 86.53846 36.53846
10 0 1 0 0 50 90.00000 36.00000
11 0 1 1 0 51 94.11765 41.17647
12 1 1 0 0 51 86.27451 39.21569
13 0 1 1 0 49 95.91837 38.77551
14 1 1 0 0 48 91.66667 43.75000
15 1 0 0 0 48 87.50000 35.41667
FirstGermTime LastGermTime PeakGermTime TimeSpreadGerm t50_Coolbear
1 5 11 6 6 5.970588
2 4 12 6 8 6.192308
3 4 12 6 8 6.333333
4 5 12 6 7 6.041667
5 5 13 6 8 5.975000
6 5 12 6 7 5.976190
7 5 11 6 6 5.972222
8 4 12 6 8 6.208333
9 4 12 6 8 6.310345
10 5 12 6 7 6.076923
11 5 13 6 8 5.928571
12 5 12 6 7 5.975000
13 5 13 6 8 6.083333
14 5 12 6 7 5.928571
15 5 11 6 6 6.050000
t50_Farooq MeanGermTime VarGermTime SEGermTime CVGermTime MeanGermRate
1 5.941176 6.700000 1.446154 0.1901416 0.1794868 0.1492537
2 6.153846 6.857143 2.027875 0.2197333 0.2076717 0.1458333
3 5.972222 6.866667 2.572727 0.2391061 0.2335882 0.1456311
4 6.225806 6.891304 2.187923 0.2180907 0.2146419 0.1451104
5 5.950000 6.812500 2.368351 0.2221275 0.2259002 0.1467890
6 5.952381 6.869565 2.071498 0.2122088 0.2095140 0.1455696
7 5.944444 6.690476 1.389663 0.1818989 0.1761967 0.1494662
8 6.166667 6.875000 2.112179 0.2297923 0.2113940 0.1454545
9 5.973684 6.866667 2.300000 0.2260777 0.2208604 0.1456311
10 6.038462 6.822222 1.831313 0.2017321 0.1983606 0.1465798
11 5.904762 6.791667 2.381206 0.2227295 0.2272072 0.1472393
12 5.950000 6.886364 2.149577 0.2210295 0.2129053 0.1452145
13 6.041667 6.936170 2.539315 0.2324392 0.2297410 0.1441718
14 5.904762 6.772727 1.900634 0.2078370 0.2035568 0.1476510
15 6.259259 6.809524 1.670151 0.1994129 0.1897847 0.1468531
VarGermRate SEGermRate CVG GermRateRecip_Coolbear
1 0.0007176543 0.004235724 14.92537 0.1674877
2 0.0009172090 0.004673148 14.58333 0.1614907
3 0.0011572039 0.005071059 14.56311 0.1578947
4 0.0009701218 0.004592342 14.51104 0.1655172
5 0.0010995627 0.004786184 14.67890 0.1673640
6 0.0009301809 0.004496813 14.55696 0.1673307
7 0.0006935558 0.004063648 14.94662 0.1674419
8 0.0009454531 0.004861721 14.54545 0.1610738
9 0.0010345321 0.004794747 14.56311 0.1584699
10 0.0008453940 0.004334343 14.65798 0.1645570
11 0.0011191581 0.004828643 14.72393 0.1686747
12 0.0009558577 0.004660905 14.52145 0.1673640
13 0.0010970785 0.004831366 14.41718 0.1643836
14 0.0009033254 0.004531018 14.76510 0.1686747
15 0.0007767634 0.004300508 14.68531 0.1652893
GermRateRecip_Farooq GermSpeed_Count GermSpeed_Percent
1 0.1683168 6.138925 12.27785
2 0.1625000 6.362698 12.47588
3 0.1674419 6.882179 14.33787
4 0.1606218 6.927417 13.58317
5 0.1680672 7.318987 14.63797
6 0.1680000 6.931782 14.14649
7 0.1682243 6.448449 13.43427
8 0.1621622 6.053175 12.87909
9 0.1674009 6.830592 13.13575
10 0.1656051 6.812698 13.62540
11 0.1693548 7.342796 14.39764
12 0.1680672 6.622258 12.98482
13 0.1655172 7.052320 14.39249
14 0.1693548 6.706782 13.97246
15 0.1597633 6.363925 13.25818
GermSpeedAccumulated_Count GermSpeedAccumulated_Percent
1 34.61567 69.23134
2 35.54058 69.68741
3 38.29725 79.78594
4 38.68453 75.85202
5 41.00786 82.01571
6 38.77620 79.13509
7 36.38546 75.80304
8 33.77079 71.85275
9 38.11511 73.29829
10 38.19527 76.39054
11 41.17452 80.73436
12 37.00640 72.56158
13 39.29399 80.19182
14 37.69490 78.53103
15 35.69697 74.36868
GermSpeedCorrected_Normal GermSpeedCorrected_Accumulated WeightGermPercent
1 0.1534731 0.8653917 47.42857
2 0.1514928 0.8462043 47.89916
3 0.1529373 0.8510501 54.46429
4 0.1505960 0.8409680 52.24090
5 0.1524789 0.8543303 56.14286
6 0.1506909 0.8429608 54.51895
7 0.1535345 0.8663205 51.93452
8 0.1513294 0.8442698 49.39210
9 0.1517909 0.8470024 50.27473
10 0.1513933 0.8487837 52.57143
11 0.1529749 0.8578026 55.18207
12 0.1505059 0.8410547 50.00000
13 0.1500494 0.8360424 55.24781
14 0.1524269 0.8567022 53.86905
15 0.1515220 0.8499278 51.19048
MeanGermPercent MeanGermNumber TimsonsIndex TimsonsIndex_Labouriau
1 5.714286 2.857143 8.000000 1.00
2 5.882353 3.000000 9.803922 1.25
3 6.696429 3.214286 14.583333 1.40
4 6.442577 3.285714 7.843137 1.00
5 6.857143 3.428571 10.000000 1.00
6 6.705539 3.285714 6.122449 1.00
7 6.250000 3.000000 8.333333 1.00
8 6.079027 2.857143 10.638298 1.25
9 6.181319 3.214286 9.615385 1.25
10 6.428571 3.214286 8.000000 1.00
11 6.722689 3.428571 9.803922 1.00
12 6.162465 3.142857 5.882353 1.00
13 6.851312 3.357143 8.163265 1.00
14 6.547619 3.142857 6.250000 1.00
15 6.250000 3.000000 8.333333 1.00
TimsonsIndex_KhanUngar GermRateGeorge GermIndex GermIndex_mod
1 0.5714286 4 5.840000 7.300000
2 0.7002801 5 5.882353 7.142857
3 1.0416667 7 6.687500 7.133333
4 0.5602241 4 6.411765 7.108696
5 0.7142857 5 6.900000 7.187500
6 0.4373178 3 6.693878 7.130435
7 0.5952381 4 6.395833 7.309524
8 0.7598784 5 6.063830 7.125000
9 0.6868132 5 6.173077 7.133333
10 0.5714286 4 6.460000 7.177778
11 0.7002801 5 6.784314 7.208333
12 0.4201681 3 6.137255 7.113636
13 0.5830904 4 6.775510 7.063830
14 0.4464286 3 6.625000 7.227273
15 0.5952381 4 6.291667 7.190476
EmergenceRateIndex_SG EmergenceRateIndex_SG_mod
1 292 7.300000
2 300 7.142857
3 321 7.133333
4 327 7.108696
5 345 7.187500
6 328 7.130435
7 307 7.309524
8 285 7.125000
9 321 7.133333
10 323 7.177778
11 346 7.208333
12 313 7.113636
13 332 7.063830
14 318 7.227273
15 302 7.190476
EmergenceRateIndex_BilbroWanjura EmergenceRateIndex_Fakorede PeakValue
1 5.970149 8.375000 9.500000
2 6.125000 8.326531 9.313725
3 6.553398 7.324444 10.416667
4 6.675079 7.640359 10.049020
5 7.045872 7.096354 11.250000
6 6.696203 7.317580 10.714286
7 6.277580 7.646259 10.416667
8 5.818182 8.078125 9.574468
9 6.553398 7.934815 9.855769
10 6.596091 7.580247 10.250000
11 7.067485 7.216146 11.029412
12 6.389439 7.981921 9.803922
13 6.776074 7.231326 10.969388
14 6.496644 7.388430 10.677083
15 6.167832 7.782313 10.156250
GermValue_Czabator GermValue_DP GermValue_Czabator_mod GermValue_DP_mod
1 54.28571 57.93890 54.28571 39.56076
2 54.78662 52.58713 54.78662 40.99260
3 69.75446 68.62289 69.75446 53.42809
4 64.74158 70.43331 64.74158 48.86825
5 77.14286 80.16914 77.14286 56.23935
6 71.84506 76.51983 71.84506 53.06435
7 65.10417 69.41325 65.10417 47.37690
8 58.20345 56.00669 58.20345 43.67948
9 60.92165 58.13477 60.92165 45.30801
10 65.89286 70.91875 65.89286 49.10820
11 74.14731 77.39782 74.14731 54.27520
12 60.41632 64.44988 60.41632 44.71582
13 75.15470 78.16335 75.15470 54.94192
14 69.90947 74.40140 69.90947 51.41913
15 63.47656 67.62031 63.47656 46.48043
CUGerm GermSynchrony GermUncertainty
1 0.7092199 0.2666667 2.062987
2 0.5051546 0.2346109 2.321514
3 0.3975265 0.2242424 2.462012
4 0.4672113 0.2502415 2.279215
5 0.4312184 0.2606383 2.146051
6 0.4934701 0.2792271 2.160545
7 0.7371500 0.2729384 2.040796
8 0.4855842 0.2256410 2.357249
9 0.4446640 0.2494949 2.321080
10 0.5584666 0.2555556 2.187983
11 0.4288905 0.2686170 2.128670
12 0.4760266 0.2737844 2.185245
13 0.4023679 0.2506938 2.241181
14 0.5383760 0.2991543 2.037680
15 0.6133519 0.2497096 2.185028
FourPHFfit.bulk()
This wrapper function can be used to fit the four-parameter hill function for multiple samples in batch.
data(gcdata)

counts.per.intervals <- c("Day01", "Day02", "Day03", "Day04", "Day05",
                          "Day06", "Day07", "Day08", "Day09", "Day10",
                          "Day11", "Day12", "Day13", "Day14")

FourPHFfit.bulk(gcdata, total.seeds.col = "Total Seeds",
                    counts.intervals.cols = counts.per.intervals,
                    intervals = 1:14, partial = TRUE,
                    fix.y0 = TRUE, fix.a = TRUE, xp = c(10, 60),
                    tmax = 20, tries = 3, umax = 90, umin = 10)
Genotype Rep Day01 Day02 Day03 Day04 Day05 Day06 Day07 Day08 Day09 Day10
1 G1 1 0 0 0 0 4 17 10 7 1 0
2 G2 1 0 0 0 1 3 15 13 6 2 1
3 G3 1 0 0 0 2 3 18 9 8 2 1
4 G4 1 0 0 0 0 4 19 12 6 2 1
5 G5 1 0 0 0 0 5 20 12 8 1 0
6 G1 2 0 0 0 0 3 21 11 7 1 1
7 G2 2 0 0 0 0 4 18 11 7 1 0
8 G3 2 0 0 0 1 3 14 12 6 2 1
9 G4 2 0 0 0 1 3 19 10 8 1 1
10 G5 2 0 0 0 0 4 18 13 6 2 1
11 G1 3 0 0 0 0 5 21 11 8 1 0
12 G2 3 0 0 0 0 3 20 10 7 1 1
13 G3 3 0 0 0 0 4 19 12 8 1 1
14 G4 3 0 0 0 0 3 21 11 6 1 0
15 G5 3 0 0 0 0 4 17 10 8 1 1
Day11 Day12 Day13 Day14 Total Seeds a b c y0 lag
1 1 0 0 0 50 80.00000 9.881937 6.034954 0 0
2 0 1 0 0 51 82.35294 9.227666 6.175193 0 0
3 1 1 0 0 48 93.75000 7.793051 6.138110 0 0
4 1 1 0 0 51 90.19608 8.925655 6.125173 0 0
5 0 1 1 0 50 96.00000 9.419181 6.049642 0 0
6 1 1 0 0 49 93.87755 9.450149 6.097415 0 0
7 1 0 0 0 48 87.50000 10.172459 6.029851 0 0
8 0 1 0 0 47 85.10638 8.940696 6.189774 0 0
9 1 1 0 0 52 86.53846 8.617391 6.125122 0 0
10 0 1 0 0 50 90.00000 9.608844 6.109504 0 0
11 0 1 1 0 51 94.11765 9.400212 6.018760 0 0
12 1 1 0 0 51 86.27451 9.162526 6.108452 0 0
13 0 1 1 0 49 95.91837 8.995210 6.149012 0 0
14 1 1 0 0 48 91.66667 10.391845 6.015910 0 0
15 1 0 0 0 48 87.50000 9.136744 6.121579 0 0
Dlag50 t50.total t10.total t60.total t50.Germinated t10.Germinated
1 6.034954 6.355121 4.956264 6.744598 6.034954 4.831807
2 6.175193 6.473490 4.983236 6.872603 6.175193 4.866755
3 6.138110 6.244191 4.673022 6.608438 6.138110 4.630062
4 6.125173 6.276794 4.850875 6.614968 6.125173 4.788597
5 6.049642 6.103433 4.814125 6.386789 6.049642 4.790946
6 6.097415 6.182279 4.868632 6.477599 6.097415 4.832471
7 6.029851 6.202812 4.930422 6.510495 6.029851 4.858476
8 6.189774 6.439510 4.940057 6.823299 6.189774 4.841105
9 6.125122 6.352172 4.836658 6.733276 6.125122 4.746573
10 6.109504 6.253043 4.920629 6.566506 6.109504 4.860681
11 6.018760 6.099435 4.798627 6.391291 6.018760 4.764246
12 6.108452 6.326184 4.893596 6.684526 6.108452 4.806013
13 6.149012 6.207501 4.841308 6.509954 6.149012 4.816393
14 6.015910 6.122389 4.915140 6.397491 6.015910 4.869398
15 6.121579 6.317392 4.892502 6.667247 6.121579 4.813083
t60.Germinated Uniformity_90 Uniformity_10 Uniformity TMGR AUC
1 6.287724 7.537690 4.831807 2.705882 5.912194 1108.976
2 6.452582 7.835407 4.866755 2.968652 6.031282 1128.559
3 6.465924 8.137342 4.630062 3.507280 5.938180 1283.693
4 6.409838 7.834810 4.788597 3.046213 5.972686 1239.887
5 6.315746 7.639028 4.790946 2.848083 5.914289 1328.328
6 6.364722 7.693469 4.832471 2.860997 5.961879 1294.463
7 6.275050 7.483643 4.858476 2.625166 5.914057 1213.908
8 6.476945 7.914163 4.841105 3.073058 6.036192 1164.346
9 6.420208 7.904041 4.746573 3.157468 5.961631 1188.793
10 6.372823 7.679177 4.860681 2.818496 5.978115 1240.227
11 6.284051 7.603611 4.764246 2.839365 5.883557 1305.200
12 6.384836 7.763854 4.806013 2.957841 5.964080 1188.021
13 6.432524 7.850345 4.816393 3.033952 5.998270 1316.407
14 6.255276 7.432372 4.869398 2.562974 5.905180 1273.385
15 6.399357 7.785806 4.813083 2.972723 5.976087 1203.664
MGT Skewness msg sigma finTol logLik AIC
1 6.632252 1.098973 #1. success 1.615220 7.105427e-14 -25.49868 56.99736
2 6.784407 1.098655 #1. success 1.115372 6.217249e-14 -20.31471 46.62943
3 6.772742 1.103392 #1. success 2.432704 1.790568e-12 -31.23213 68.46426
4 6.739666 1.100323 #1. success 2.396582 8.526513e-14 -31.02269 68.04538
5 6.654981 1.100062 #1. success 2.399662 1.094236e-12 -31.04067 68.08135
6 6.702473 1.099232 #1. success 3.034962 1.392664e-12 -34.32887 74.65774
7 6.622417 1.098272 #1. success 1.663019 7.815970e-14 -25.90697 57.81395
8 6.804000 1.099232 #1. success 1.120704 4.302336e-12 -20.38149 46.76298
9 6.745241 1.101242 #1. success 2.429960 8.810730e-13 -31.21633 68.43266
10 6.711900 1.098600 #1. success 1.686656 8.199663e-12 -26.10456 58.20911
11 6.624248 1.100600 #1. success 2.628113 2.984279e-13 -32.31381 70.62762
12 6.718639 1.099892 #1. success 2.878146 9.663381e-13 -33.58613 73.17227
13 6.762274 1.099733 #1. success 2.604588 3.126388e-13 -32.18793 70.37586
14 6.604967 1.097916 #1. success 2.764756 9.379164e-13 -33.02342 72.04684
15 6.732266 1.099760 #1. success 1.954008 5.400125e-13 -28.16444 62.32888
BIC deviance df.residual nobs
1 58.91453 31.30723 12 14
2 48.54660 14.92865 12 14
3 70.38143 71.01658 12 14
4 69.96256 68.92324 12 14
5 69.99852 69.10052 12 14
6 76.57491 110.53195 12 14
7 59.73112 33.18760 12 14
8 48.68015 15.07174 12 14
9 70.34984 70.85647 12 14
10 60.12629 34.13771 12 14
11 72.54479 82.88372 12 14
12 75.08944 99.40469 12 14
13 72.29303 81.40654 12 14
14 73.96401 91.72652 12 14
15 64.24606 45.81777 12 14Multiple fitted curves generated in batch can also be plotted.
data(gcdata)

counts.per.intervals <- c("Day01", "Day02", "Day03", "Day04", "Day05",
                          "Day06", "Day07", "Day08", "Day09", "Day10",
                          "Day11", "Day12", "Day13", "Day14")

fits <- FourPHFfit.bulk(gcdata, total.seeds.col = "Total Seeds",
                    counts.intervals.cols = counts.per.intervals,
                    intervals = 1:14, partial = TRUE,
                    fix.y0 = TRUE, fix.a = TRUE, xp = c(10, 60),
                    tmax = 20, tries = 3, umax = 90, umin = 10)

# Plot FPHF curves
plot(fits, group.col = "Genotype")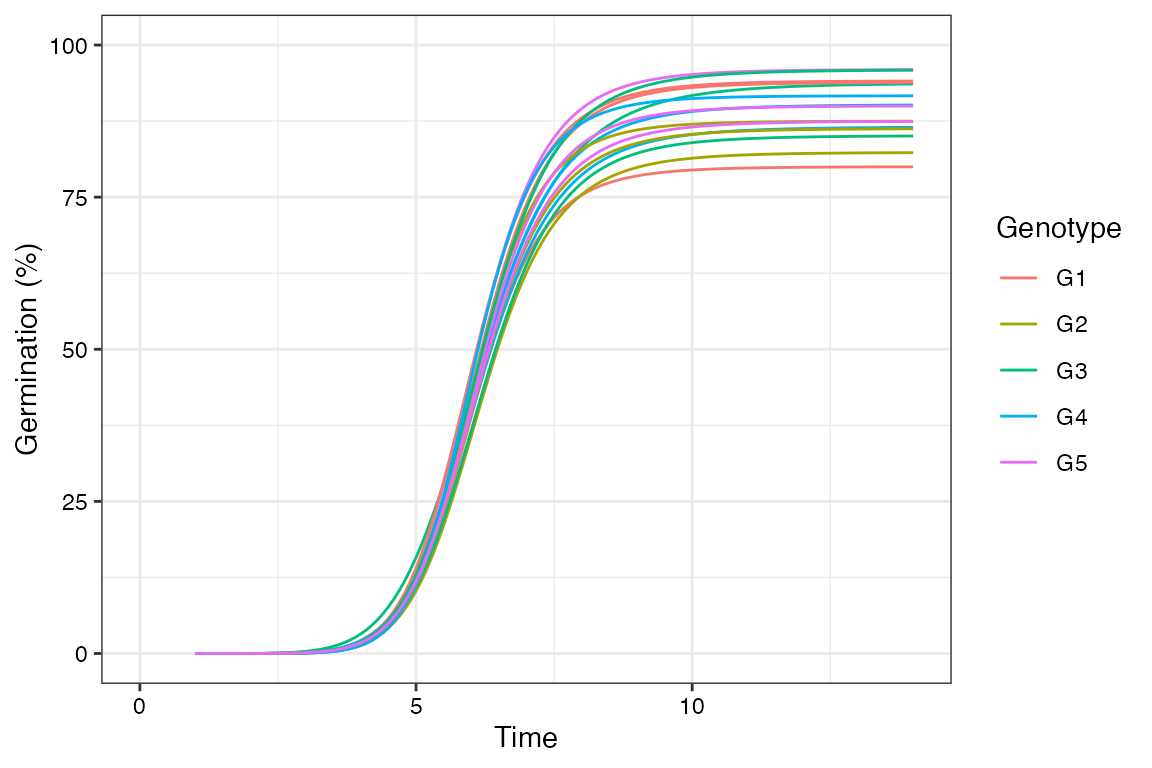
# Plot ROG curves
plot(fits, rog = TRUE, group.col = "Genotype")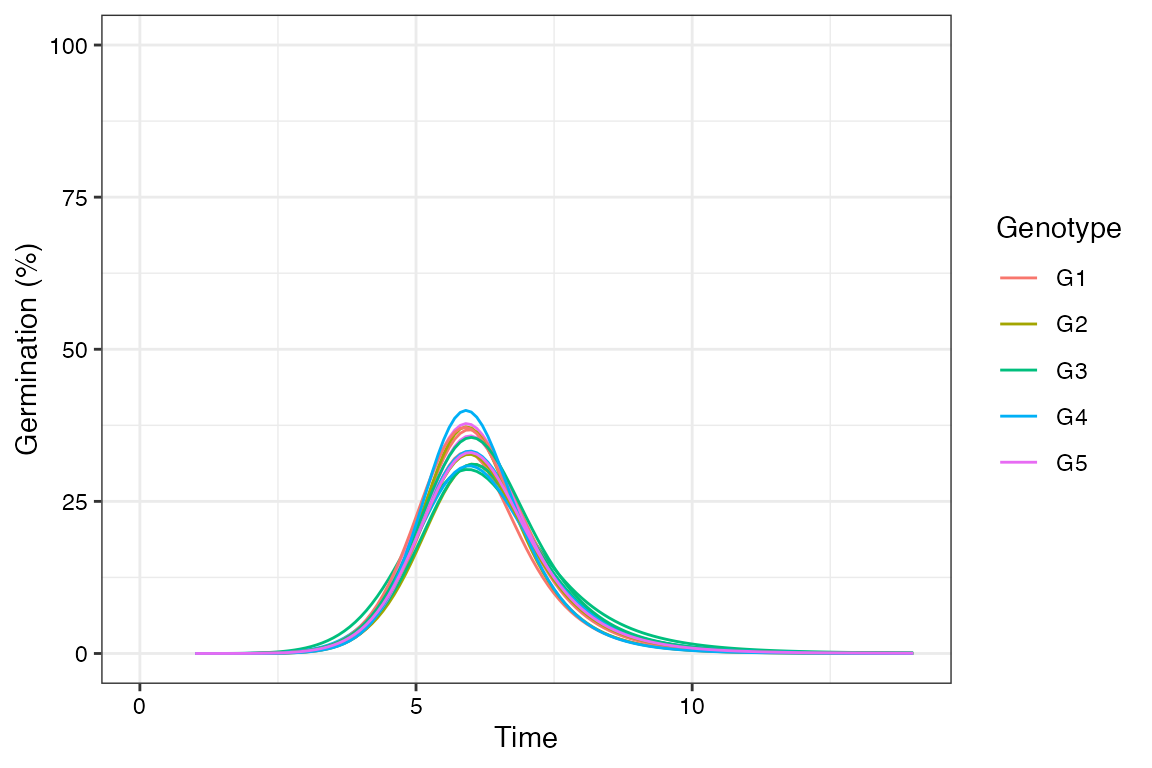
# Plot FPHF curves with points
plot(fits, group.col = "Genotype", show.points = TRUE)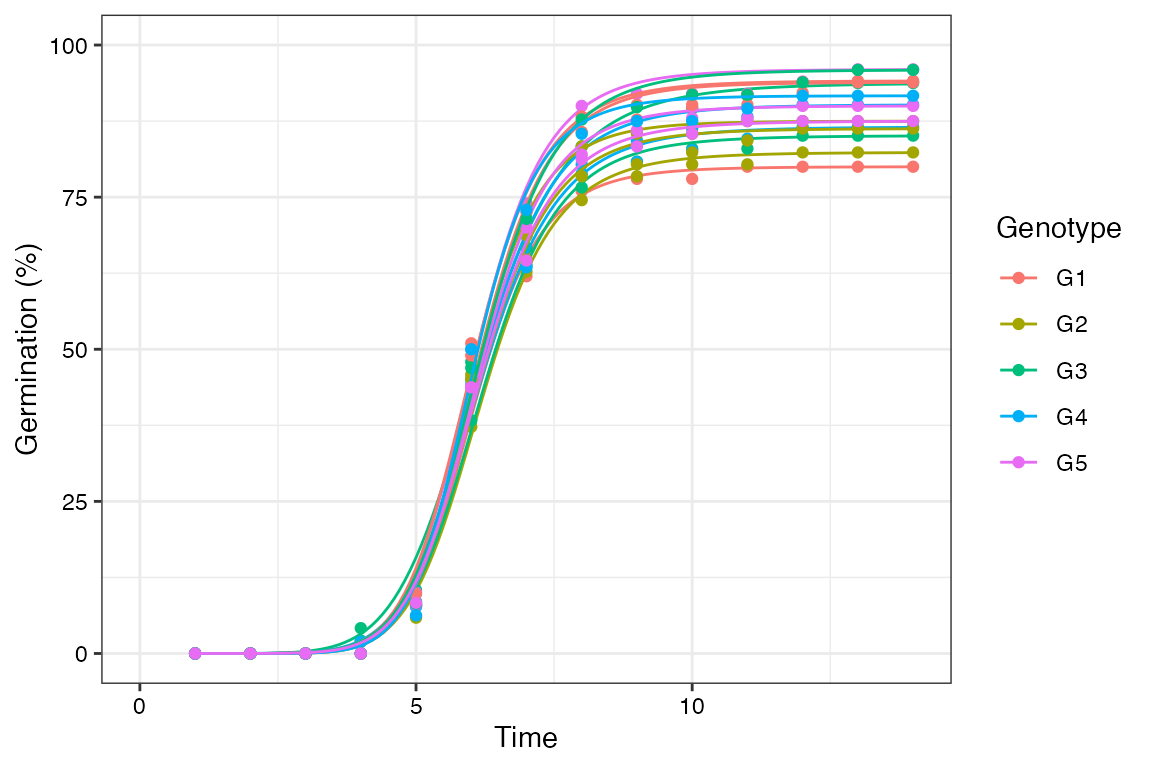
# Plot FPHF curves with annotations
plot(fits, group.col = "Genotype", annotate = "t50.total")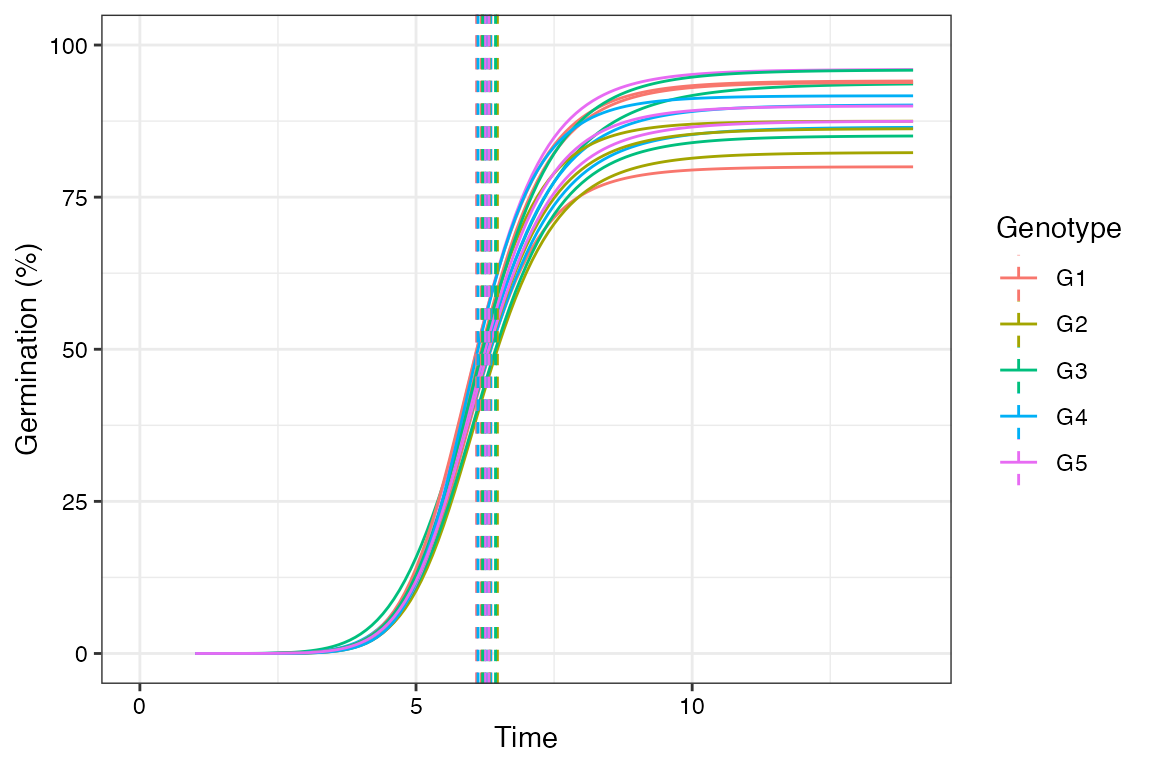
plot(fits, group.col = "Genotype", annotate = "t50.germ")
plot(fits, group.col = "Genotype", annotate = "tmgr")
plot(fits, group.col = "Genotype", annotate = "mgt")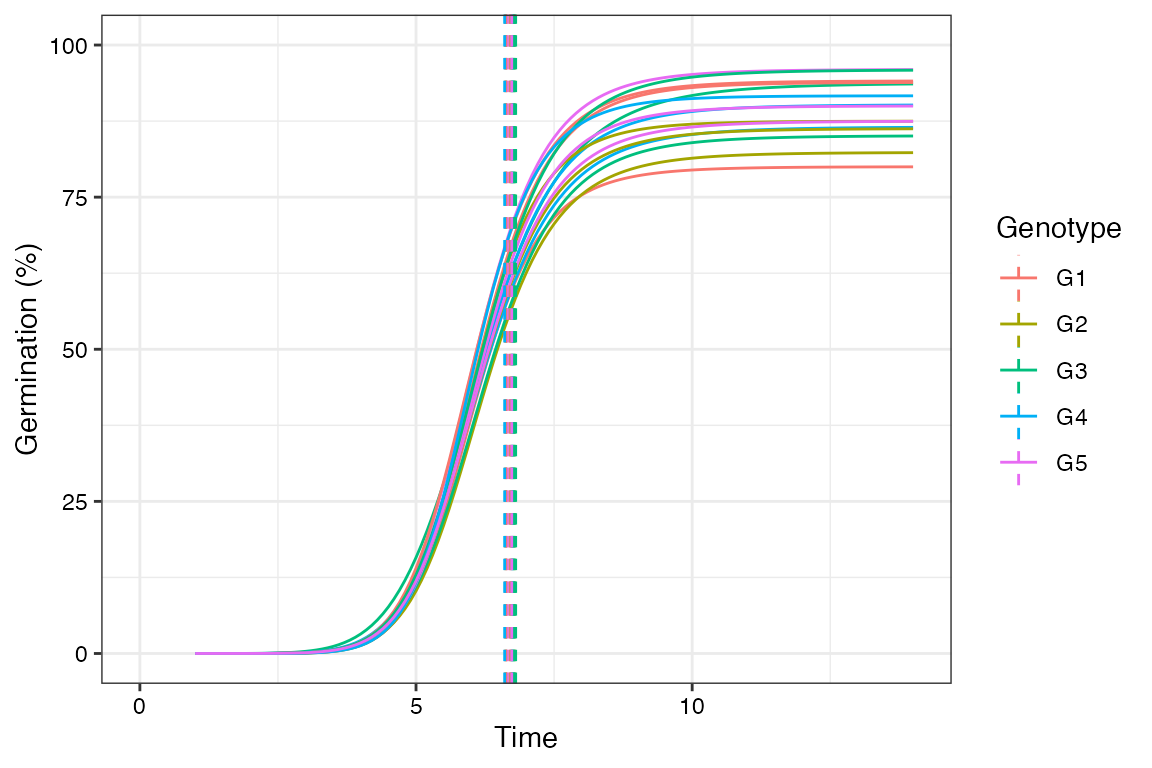
plot(fits, group.col = "Genotype", annotate = "uniformity")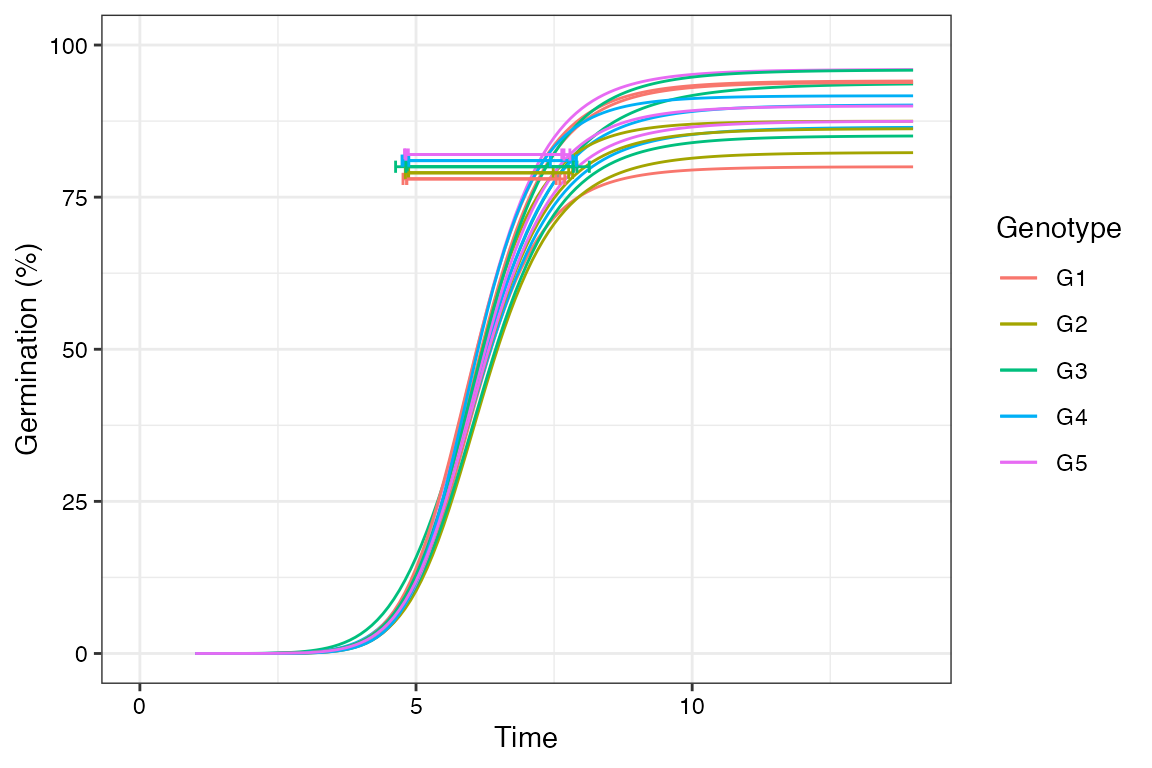
# Plot ROG curves with annotations
plot(fits, rog = TRUE, group.col = "Genotype", annotate = "t50.total")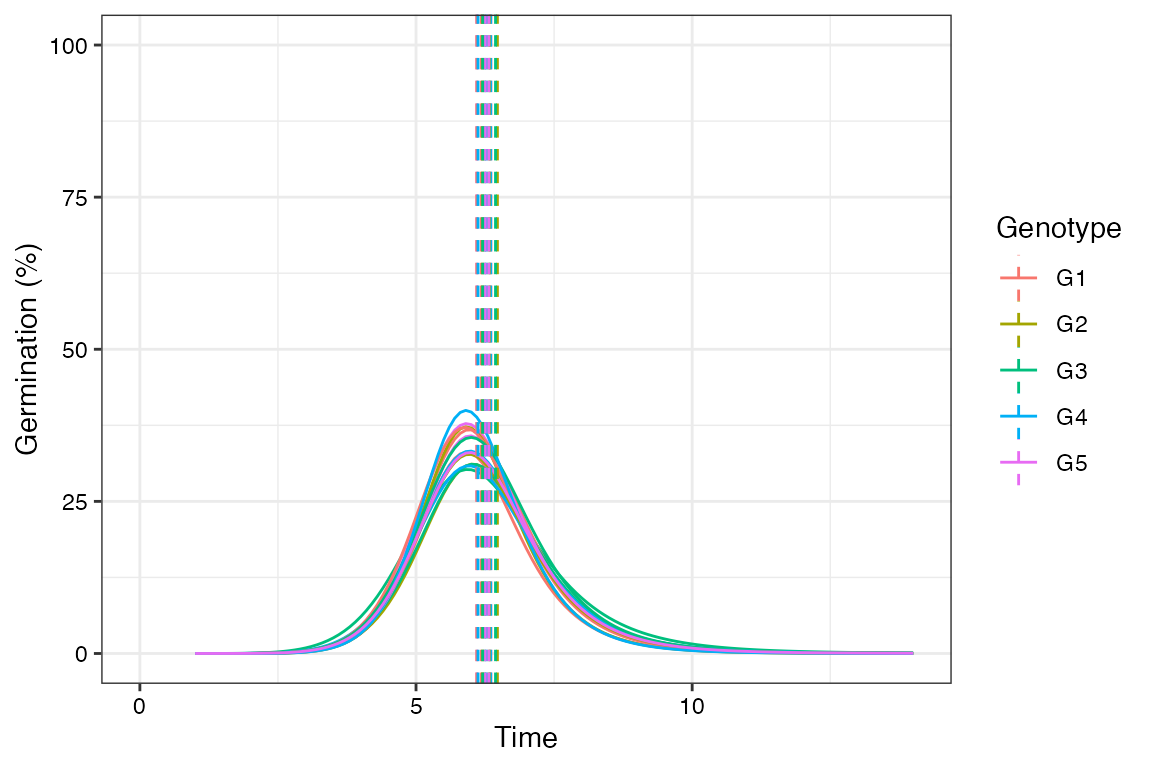
plot(fits, rog = TRUE, group.col = "Genotype", annotate = "t50.germ")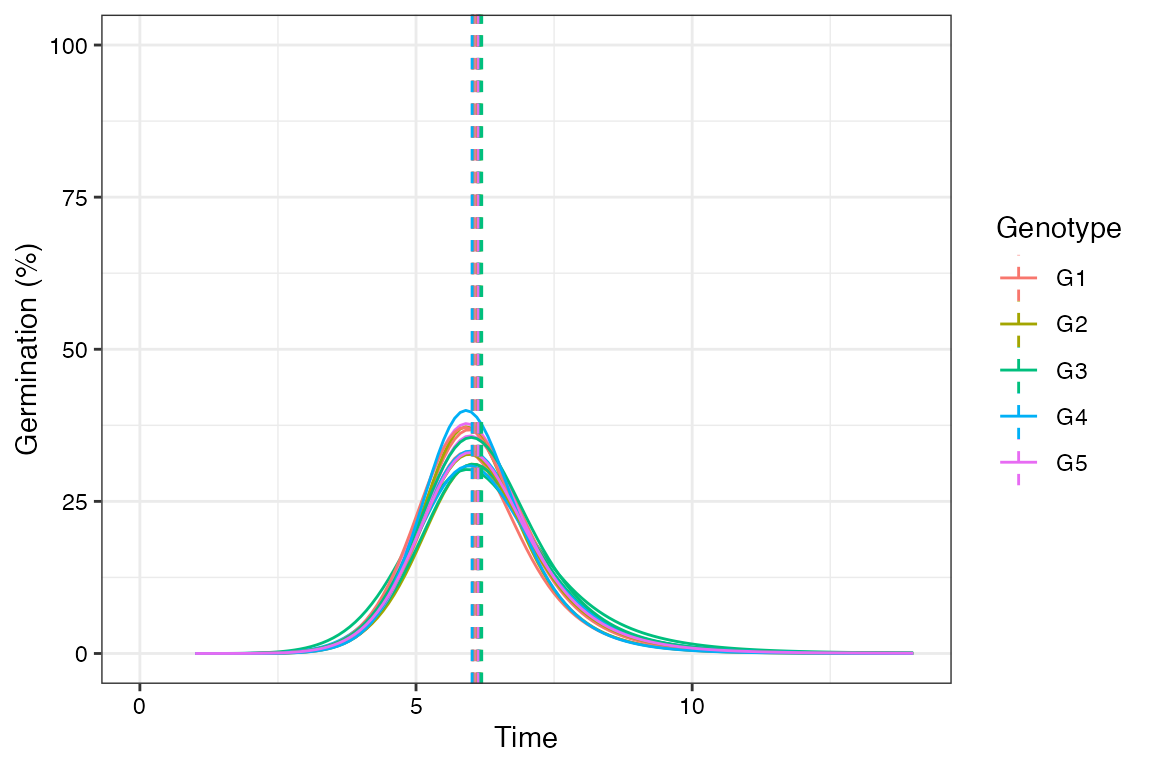
plot(fits, rog = TRUE, group.col = "Genotype", annotate = "tmgr")
plot(fits, rog = TRUE, group.col = "Genotype", annotate = "mgt")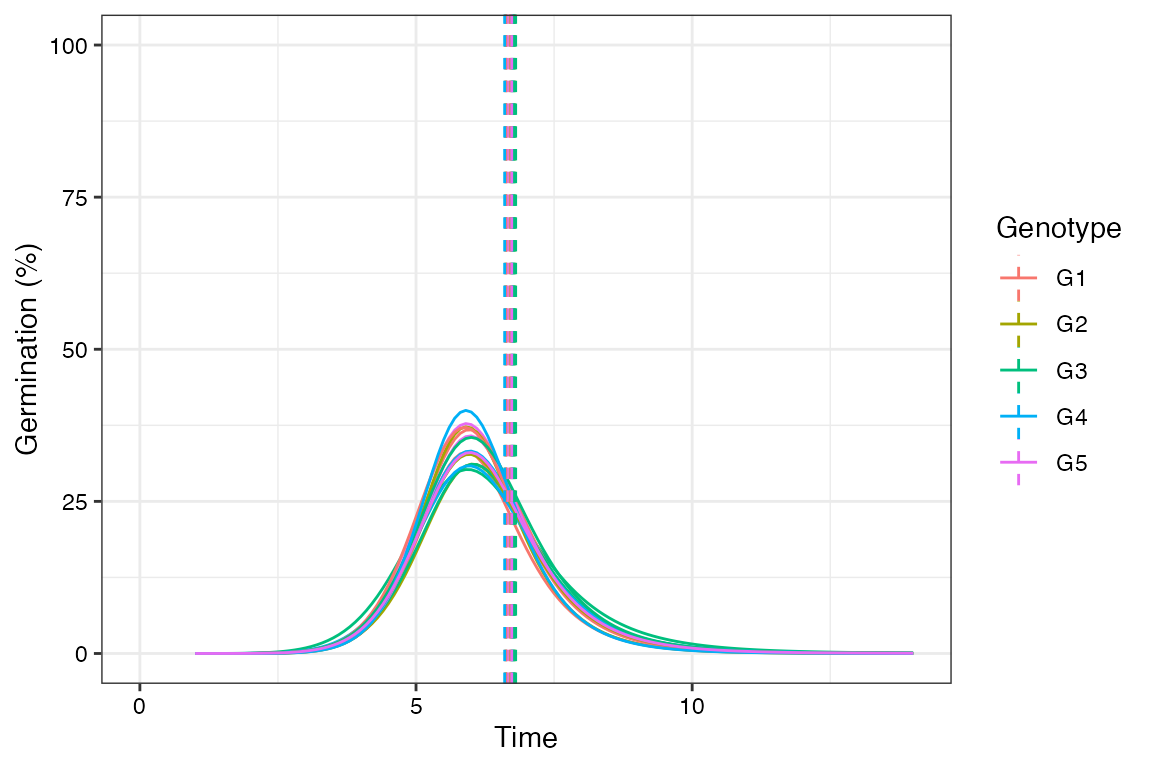
plot(fits, rog = TRUE, group.col = "Genotype", annotate = "uniformity")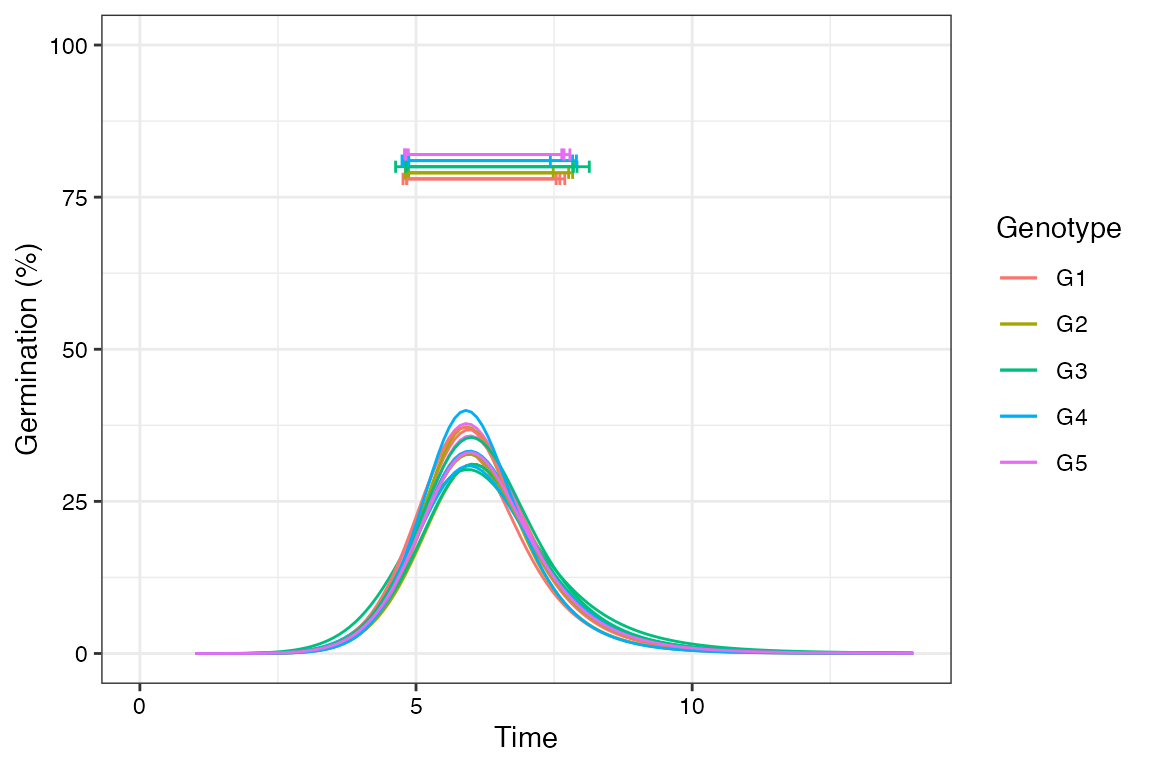
# Change colour of curves using ggplot2 options
library(ggplot2)
curvesplot <- plot(fits, group.col = "Genotype")

# 'Dark2' palette from RColorBrewer
curvesplot + scale_colour_brewer(palette = "Dark2")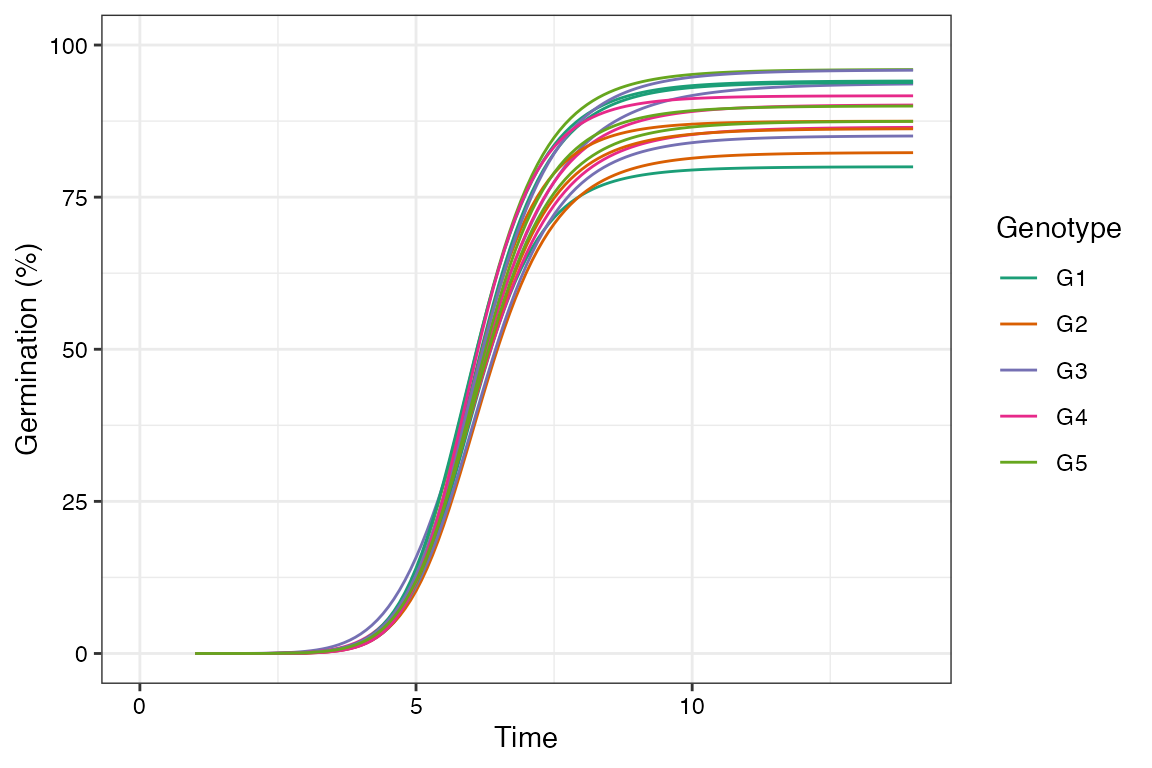
# Manual colours
curvesplot +
  scale_colour_manual(values = c("Coral", "Brown", "Blue",
                                 "Aquamarine", "Red"))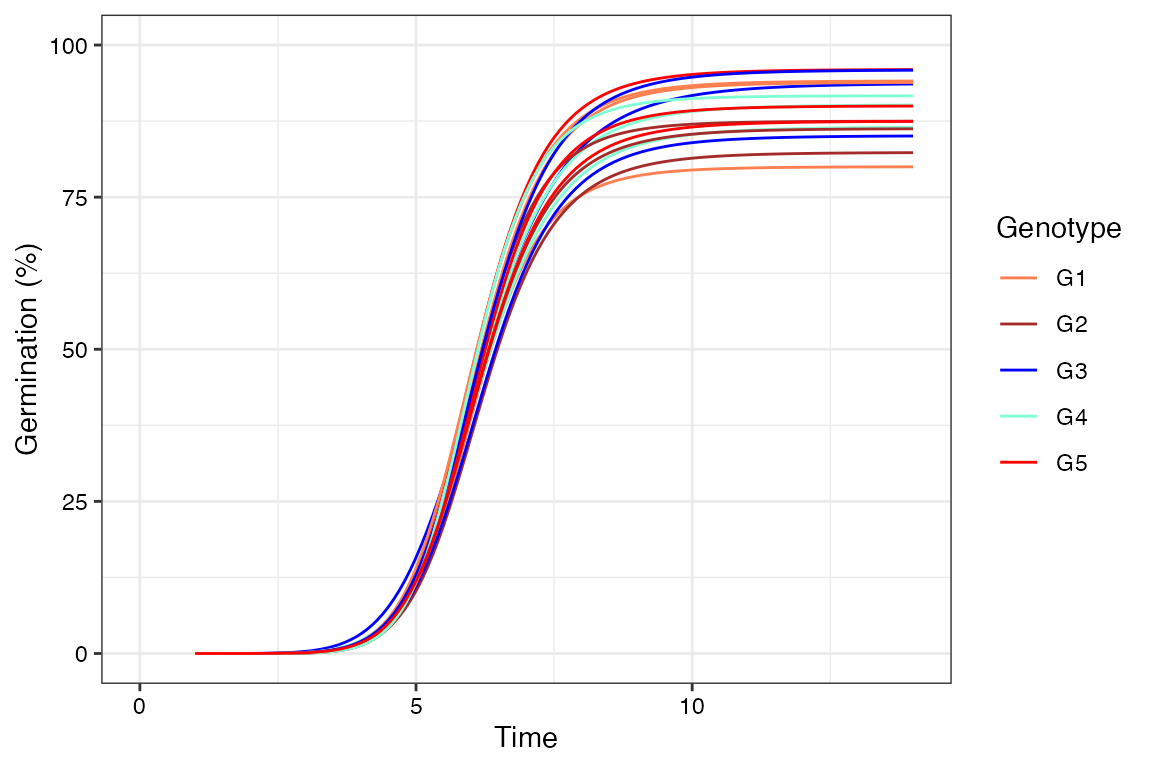
Citing germinationmetrics
To cite the R package 'germinationmetrics' in publications use:

  Aravind, J., Vimala Devi, S., Radhamani, J., Jacob, S. R., and
  Kalyani Srinivasan (2026).  germinationmetrics: Seed Germination
  Indices and Curve Fitting. R package version 0.1.10.9000,
  https://github.com/aravind-j/germinationmetrics
  https://cran.r-project.org/package=germinationmetrics.

A BibTeX entry for LaTeX users is

  @Manual{,
    title = {germinationmetrics: Seed Germination Indices and Curve Fitting},
    author = {J. Aravind and S. {Vimala Devi} and J. Radhamani and Sherry Rachel Jacob and {Kalyani Srinivasan}},
    note = {R package version 0.1.10.9000 https://aravind-j.github.io/germinationmetrics/ https://CRAN.R-project.org/package=germinationmetrics},
    year = {2026},
  }

This free and open-source software implements academic research by the
authors and co-workers. If you use it, please support the project by
citing the package.
Session Info
R version 4.6.0 (2026-04-24)
Platform: aarch64-apple-darwin23
Running under: macOS Sequoia 15.7.4

Matrix products: default
BLAS:   /Library/Frameworks/R.framework/Versions/4.6/Resources/lib/libRblas.0.dylib
LAPACK: /Library/Frameworks/R.framework/Versions/4.6/Resources/lib/libRlapack.dylib;  LAPACK version 3.12.1

locale:
[1] en_US.UTF-8/en_US.UTF-8/en_US.UTF-8/C/en_US.UTF-8/en_US.UTF-8

time zone: UTC
tzcode source: internal

attached base packages:
[1] stats     graphics  grDevices utils     datasets  methods   base

other attached packages:
[1] germinationmetrics_0.1.10.9000 ggplot2_4.0.3

loaded via a namespace (and not attached):
 [1] sass_0.4.10         generics_0.1.4      tidyr_1.3.2
 [4] stringi_1.8.7       lattice_0.22-9      digest_0.6.39
 [7] magrittr_2.0.5      evaluate_1.0.5      grid_4.6.0
[10] RColorBrewer_1.1-3  fastmap_1.2.0       plyr_1.8.9
[13] jsonlite_2.0.0      Matrix_1.7-5        ggrepel_0.9.8
[16] backports_1.5.1     httr_1.4.8          pander_0.6.6
[19] purrr_1.2.2         scales_1.4.0        XML_3.99-0.23
[22] textshaping_1.0.5   jquerylib_0.1.4     Rdpack_2.6.6
[25] cli_3.6.6           rlang_1.2.0         rbibutils_2.4.1
[28] withr_3.0.2         cachem_1.1.0        yaml_2.3.12
[31] otel_0.2.0          tools_4.6.0         reshape2_1.4.5
[34] dplyr_1.2.1         mathjaxr_2.0-0      broom_1.0.12
[37] curl_7.1.0          vctrs_0.7.3         R6_2.6.1
[40] stats4_4.6.0        lifecycle_1.0.5     gslnls_1.4.2
[43] stringr_1.6.0       fs_2.1.0            htmlwidgets_1.6.4
[46] ragg_1.5.2          pkgconfig_2.0.3     desc_1.4.3
[49] pkgdown_2.2.0       pillar_1.11.1       bslib_0.10.0
[52] gtable_0.3.6        data.table_1.18.2.1 glue_1.8.1
[55] Rcpp_1.1.1-1.1      systemfonts_1.3.2   xfun_0.57
[58] tibble_3.3.1        tidyselect_1.2.1    knitr_1.51
[61] farver_2.1.2        htmltools_0.5.9     labeling_0.4.3
[64] rmarkdown_2.31      compiler_4.6.0      S7_0.2.2